A random sample of size 30 from an exponential distribution with mean 5 is simulated. Describe th...
A random sample of size 30 from an exponential distribution with mean 5 is simulated.
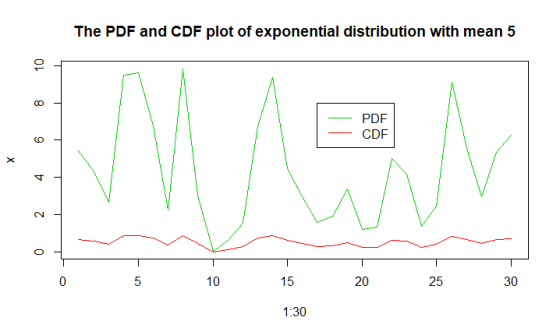
Describe the process of plotting the empirical cdf for this sample along with the true cdf in the sample graph.
Homework Answers
We have calculated pdf and cdf of exponential with mean 5,
for plotting steps
1)
we draw 30 samples from pdf
2)
then for these 30 samples we draw find CDF of those 30 corresponding samples,
3)
then we plot PDF and CDF on same graph taking x axis as 1:30
plot is
random samples are
| Observation | CDF | |
| 1 | 5.446 | 0.664 |
| 2 | 4.31 | 0.578 |
| 3 | 2.646 | 0.411 |
| 4 | 9.489 | 0.85 |
| 5 | 9.636 | 0.854 |
| 6 | 6.771 | 0.742 |
| 7 | 2.227 | 0.359 |
| 8 | 9.852 | 0.861 |
| 9 | 2.997 | 0.451 |
| 10 | 0.017 | 0.003 |
| 11 | 0.595 | 0.112 |
| 12 | 1.538 | 0.265 |
| 13 | 6.73 | 0.74 |
| 14 | 9.365 | 0.846 |
| 15 | 4.489 | 0.593 |
| 16 | 2.948 | 0.445 |
| 17 | 1.57 | 0.269 |
| 18 | 1.894 | 0.315 |
| 19 | 3.394 | 0.493 |
| 20 | 1.215 | 0.216 |
| 21 | 1.311 | 0.231 |
| 22 | 5.001 | 0.632 |
| 23 | 4.177 | 0.566 |
| 24 | 1.373 | 0.24 |
| 25 | 2.462 | 0.389 |
| 26 | 9.11 | 0.838 |
| 27 | 5.547 | 0.67 |
| 28 | 2.945 | 0.445 |
| 29 | 5.338 | 0.656 |
| 30 | 6.285 | 0.716 |
Add Answer to:
A random sample of size 30 from an exponential distribution with mean 5 is simulated. Describe th...
X i , x , X" be a random sample of size n from an exponential...
 X i , x , X" be a random sample of size n from an exponential distribution with mean ? a) For large sample size, construct a 95% confidence interval for ?? b) If n 30, x 90, give the endpoints for a 90% CI for ?
09 , Let Xi, X2 Xn be a random sample from an exponential distribution with mean...
 09 , Let Xi, X2 Xn be a random sample from an exponential distribution with mean 0. (a) Show that a best critical region for testing Ho: 9 3 against Hj:e 5 can be (b) If n-12, use the fact that (2/8) ???, iEX2(24) to find a best critical region of based on the statistic ?, xi . size a 0.1 (12 marks)
A random sample of size n=30 is to be drawn from a population with a mean...
A random sample of size n=30 is to be drawn from a population with a mean of 500 and a standard deviation of 200. What is the standard error of the sampling distribution of x̅? 200 36.51 30 91.29
Actuarial Science You draw a random sample of n from an exponential distribution with mean 2....
Actuarial Science You draw a random sample of n from an exponential distribution with mean 2. (This means there are n independent, identically distributed exponential variables each with mean 2.) Determine the smallest integer n such that the average value of the sample lies within 0.05 from its mean with a probability of at least 0.80.
Let X1,X2,X3,X4 be observations of a random sample of n-4 from the exponential distribution having mean...
 Let X1,X2,X3,X4 be observations of a random sample of n-4 from the exponential distribution having mean 5, What is the mgf of Y-X1 X2 X3 X4? 4. 5. What is the distribution of Y? What is the mgf of the sample mean X = X+X+Xa+X1 ? 6. 7. What is the distribution of the sample mean?
Q6: Let X1, ..., Xn be a random sample of size n from an exponential distribution,...
 Q6: Let X1, ..., Xn be a random sample of size n from an exponential distribution, Xi ~ EXP(1,n). A test of Ho : n = no versus Hain > no is desired, based on X1:n. (a) Find a critical region of size a of the form {X1:n > c}. (b) Derive the power function for the test of (a).
Let Yi, Ys,.., Y's be a random sample of size 5 from a normal distribution mean 0 and standard de...
 Let Yi, Ys,.., Y's be a random sample of size 5 from a normal distribution mean 0 and standard deviation 1 and let-3x /5 . Let Y6 be another independent observation from the same distribution. Find the distributions of the following random variables i-1 2(572 +Y) (b) WW
Let Yi, Ys,.., Y's be a random sample of size 5 from a normal distribution mean 0 and standard deviation 1 and let-3x /5 . Let Y6 be another independent observation from...
Let Yi, Ys,.., Y's be a random sample of size 5 from a normal distribution mean 0 and standard deviation 1 and let-3x /5 . Let Y6 be another independent observation from the same distribution. Find the distributions of the following random variables i-1 2(572 +Y) (b) WW
Let Yi, Ys,.., Y's be a random sample of size 5 from a normal distribution mean 0 and standard deviation 1 and let-3x /5 . Let Y6 be another independent observation from...
Let X1, X2, ... , Xn be a random sample of size n from the exponential...
Let X1, X2, ... , Xn be a random sample of size n from the exponential distribution whose pdf is f(x; θ) = (1/θ)e^(−x/θ) , 0 < x < ∞, 0 <θ< ∞. Find the MVUE for θ. Let X1, X2, ... , Xn be a random sample of size n from the exponential distribution whose pdf is f(x; θ) = θe^(−θx) , 0 < x < ∞, 0 <θ< ∞. Find the MVUE for θ.
LetX1,...,Xn be a random sample of size n from the geometric distribution for which p is...
LetX1,...,Xn be a random sample of size n from the geometric distribution for which p is the probability of success. (a) Use the method of moments to find a point estimator for p. (b) Use the following data (simulated from geometric distribution) to find the moment estimator for p: 2 5 7 43 18 19 16 11 22 4 34 19 21 23 6 21 7 12 The pdf of a geometric distribution is f(x)= p(1-p)^x-1, for x,.... Also population...
Consider a random sample of size n from a two-parameter exponential distribution, Xi ~ EXP(\theta ,\eta)....
Consider a random sample of size n from a two-parameter exponential distribution, Xi ~ EXP(\theta ,\eta). Recall from Exercise12 that X1:n and \bar{X} are jointly sufficient for \theta and \eta . (Exercise12: Let X1, . . . , Xn be a random sample from a two-parameter exponential distribution, Xi ~ EXP(\theta ,\eta). Show that X1:n and \bar{X} are jointlly sufficient for \theta and \eta .) Because X1:n is complete and sufficient for \eta for each fixed value of \theta ,...
 X i , x , X" be a random sample of size n from an exponential distribution with mean ? a) For large sample size, construct a 95% confidence interval for ?? b) If n 30, x 90, give the endpoints for a 90% CI for ?
 09 , Let Xi, X2 Xn be a random sample from an exponential distribution with mean 0. (a) Show that a best critical region for testing Ho: 9 3 against Hj:e 5 can be (b) If n-12, use the fact that (2/8) ???, iEX2(24) to find a best critical region of based on the statistic ?, xi . size a 0.1 (12 marks)
 Let X1,X2,X3,X4 be observations of a random sample of n-4 from the exponential distribution having mean 5, What is the mgf of Y-X1 X2 X3 X4? 4. 5. What is the distribution of Y? What is the mgf of the sample mean X = X+X+Xa+X1 ? 6. 7. What is the distribution of the sample mean?
 Q6: Let X1, ..., Xn be a random sample of size n from an exponential distribution, Xi ~ EXP(1,n). A test of Ho : n = no versus Hain > no is desired, based on X1:n. (a) Find a critical region of size a of the form {X1:n > c}. (b) Derive the power function for the test of (a).
 Let Yi, Ys,.., Y's be a random sample of size 5 from a normal distribution mean 0 and standard deviation 1 and let-3x /5 . Let Y6 be another independent observation from the same distribution. Find the distributions of the following random variables i-1 2(572 +Y) (b) WW
Let Yi, Ys,.., Y's be a random sample of size 5 from a normal distribution mean 0 and standard deviation 1 and let-3x /5 . Let Y6 be another independent observation from...
Let Yi, Ys,.., Y's be a random sample of size 5 from a normal distribution mean 0 and standard deviation 1 and let-3x /5 . Let Y6 be another independent observation from the same distribution. Find the distributions of the following random variables i-1 2(572 +Y) (b) WW
Let Yi, Ys,.., Y's be a random sample of size 5 from a normal distribution mean 0 and standard deviation 1 and let-3x /5 . Let Y6 be another independent observation from...
Most questions answered within 3 hours.
-
Minitab Problem: Take the Lake Hume June rainfall data and find
use the processes outlined in...
asked 35 minutes ago -
X Company is trying to decide whether to continue using old
equipment to make Product A...
asked 36 minutes ago -
IN PYTHON ONLY !! Program 2: Re-work
program #5 (WeeklyHours) from the previous assignment such that...
asked 1 hour ago -
The average length of time between arrivals at a turnpike
toll-booth is 26 seconds. What is...
asked 2 hours ago -
(a) A piston at 6.1 atm contains a gas that occupies a volume of
3.5 L....
asked 4 hours ago -
Please answer true or false. Words
cannot be changed or added in to make it true...
asked 4 hours ago -
An empty test tube weighs 15.923 grams. Then,
MgCl2•6H2O is added into the test tube. After...
asked 4 hours ago -
Assume memory access is 10 units of time and disk access is
10000 units of time....
asked 4 hours ago -
1. Are all good samples random?
2. Magazines often report surveys giving statistics such as “63%...
asked 4 hours ago -
Under all the various types of market structures, firms
must eventually earn some economic profits for...
asked 4 hours ago -
Consider the following fitness regime for a single locus trait
with two co-dominant alleles: w11 =...
asked 4 hours ago -
A large cable company reports the following.
80% of its customers subscribe to its cable TV...
asked 4 hours ago