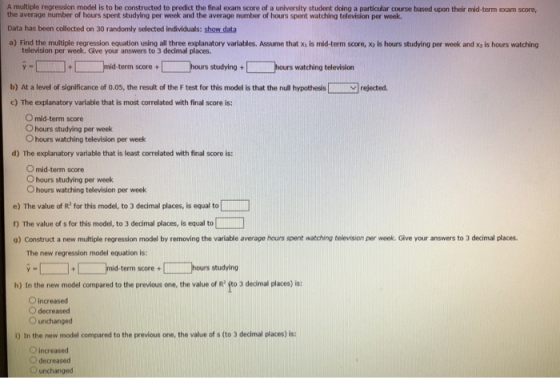

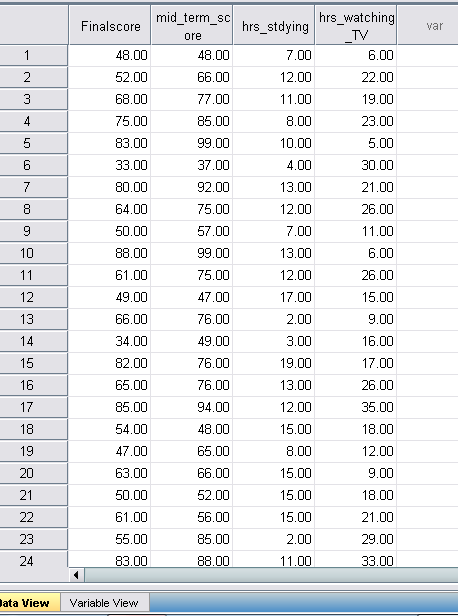
the average number of hours spent studying per week and the average number of hours spent wato Data has been collected on 30 randomly selected individuals: hide data Hours studying Hours watching TV Final score 48 52 68 75 83 Mid-term Score per week per week 48 12 73 19 85 23 10 37 92 75 80 13 21 15 26 50 13 12 17 61 75 47 76 49 76 76 94 48 65 26 49 15 34 82 65 85 19 13 12 15 16 17 26 35 18 12 47 63 50 61 15 15 15 18 52 56 85 21 83 24 40 49 21 40 24 18 17 10 18 19 18 30 20 68 73 34 a) Find the multiple regression equation using all three explanatory variables. Assume that x, is mid-term television per week. Give your answers to 3 decimal places. d-term scorehours studying hours watching televisi score + Q Type here to search
Homework Answers
The Answer is already submitted,
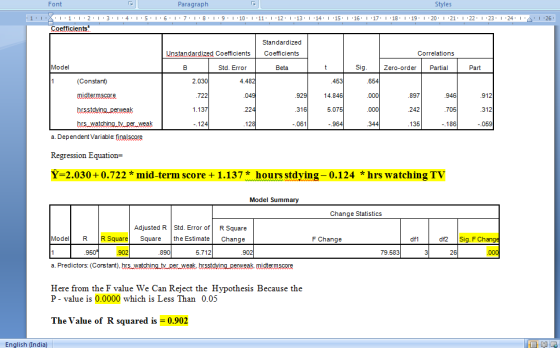
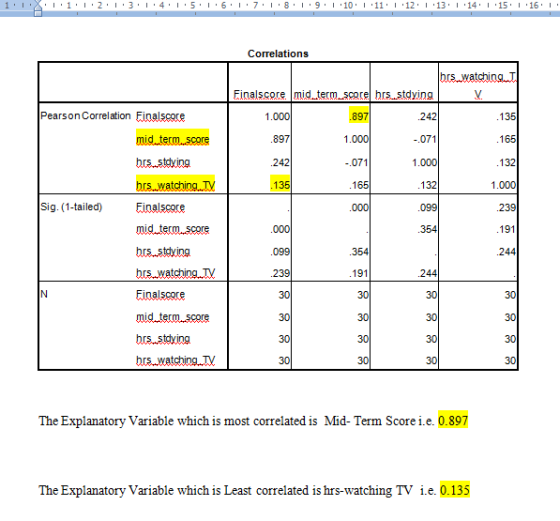
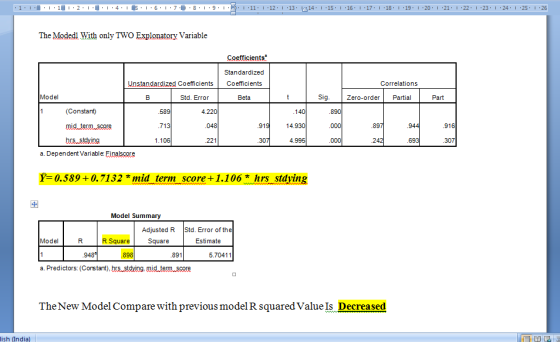
SPSS Output of regession
Add Answer to:
A multiple regression model is to be constructed to predict the final exam score of a university ...
a) Find the multiple regression equation using all three explanatory variables. Assume that X1 is mid-term...
 a) Find the multiple regression equation using all three explanatory variables. Assume that X1 is mid-term score, X2 is hours studying per week and x3 is hours watching television per week. Give your answers to 3 decimal places. û = mid-term score + hours studying + hours watching television + b) At a level of significance of 0.05, the result of the F test for this model is that the null hypothesis rejected. c) The explanatory variable that is most...
A multiple regression model is to be constructed to predict the heart rate in beats per...
 A multiple regression model is to be constructed to predict the
heart rate in beats per minute (bpm) of a person based upon their
age, weight and height.
Data has been collected on 30 randomly selected individuals:
Point,Heart rate,Age,Weight,Height
1,62,22,148,74
2,57,28,105,57
3,84,52,109,70
4,120,43,211,61
5,76,38,164,62
6,72,47,109,69
7,117,49,215,73
8,115,41,259,70
9,118,59,213,61
10,65,39,114,71
11,84,53,115,67
12,99,23,258,57
13,80,30,262,64
14,76,35,123,58
15,75,41,173,74
16,104,44,161,73
17,92,53,198,60
18,61,39,122,62
19,108,42,237,65
20,69,30,214,70
21,121,52,180,57
22,94,48,136,63
23,76,43,172,72
24,65,38,134,58
25,65,20,199,60
26,82,36,187,74
27,55,26,195,70
28,64,44,114,65
29,125,55,186,58
30,116,58,212,69
1 of 7 ID: MST.MR.CM.01.0010 (14 points) A multiple regression model...
A multiple regression model is to be constructed to predict the
heart rate in beats per minute (bpm) of a person based upon their
age, weight and height.
Data has been collected on 30 randomly selected individuals:
Point,Heart rate,Age,Weight,Height
1,62,22,148,74
2,57,28,105,57
3,84,52,109,70
4,120,43,211,61
5,76,38,164,62
6,72,47,109,69
7,117,49,215,73
8,115,41,259,70
9,118,59,213,61
10,65,39,114,71
11,84,53,115,67
12,99,23,258,57
13,80,30,262,64
14,76,35,123,58
15,75,41,173,74
16,104,44,161,73
17,92,53,198,60
18,61,39,122,62
19,108,42,237,65
20,69,30,214,70
21,121,52,180,57
22,94,48,136,63
23,76,43,172,72
24,65,38,134,58
25,65,20,199,60
26,82,36,187,74
27,55,26,195,70
28,64,44,114,65
29,125,55,186,58
30,116,58,212,69
1 of 7 ID: MST.MR.CM.01.0010 (14 points) A multiple regression model...
A business statistics professor would like to develop a regression model to predict the final exam...
A business statistics professor would like to develop a regression model to predict the final exam scores (y) for students based on their current GPAs (x1), the number of hours they studied for the exam (x2), and the number of times they were absent during the semester (x3). Score GPA Hours Absences 68 2.53 3.00 0 70 2.60 2.50 1 74 3.08 6.00 4 77 3.35 1.50 0 78 2.99 2.00 3 79 2.80 4.50 0 83 3.25 3.00 1...
What is the relationship between the amount of time statistics students study per week and their...
 What is the relationship between the amount of time statistics students study per week and their final exam scores? The results of the survey are shown below. Time Score 3 10 15 512 015 58 75 89 89 77 79 54 96 a. Find the correlation coefficient: r = Round to 2 decimal places. b. The null and alternative hypotheses for correlation are: Ho: ? - 0 H: 70 (Round to four The p-value is: decimal places) c. Use a...
Run a regression analysis on the following data set, where y is the final grade in...
Run a regression analysis on the following data set, where y is the final grade in a math class and x is the average number of hours the student spent working on math each week. hours/week x Grade y x y 4 40.6 6 62.4 7 68.8 8 70.2 10 76 11 82.4 13 77.2 14 79.6 15 96 19 100 State the regression equation y = m ⋅ x + b , with constants accurate to two decimal places....
I need help with - (c) Predict the final exam score for a student who misses...
I need help with - (c) Predict the final exam score for a student who misses five class periods. - at the bottom. Thank you! The accompanying data represent the number of days absent, x, and the final exam score, y, for a sample of college students in a general education course at a large state university. Number of absences, x Final exam score, y 0 88.5 1 86.1 2 83.2 3 81.6 4 77.4 5 74.6 6 65.3 7 ...
A business statistics professor at a college would like to develop a regression model to predict...
 A business statistics professor at a college would like to develop a regression model to predict the final exam scores for students based on their current GPS, the number of hours they studied for the exam and the number of times they were absent during the semester. The data for these variables are in the accompanying table Complete parts a through d below. ERE Click the icon to view the table of data a. Constructa regression models independent variables. Let...
Find the equation of the regression line for the given data. Then construct a scatter plot...
 Find the equation of the regression line for the given data. Then construct a scatter plot of the data and draw the regression line. (The pair of variables have a significant correlation.) Then use the regression equation to predict the value of y for each of the given x-values, if meaningful. The number of hours 6 students spent for a test and their scores on that test are shown below. Hours spent studying, X 2 5 5 (a) x =...
please correct red error boxes What is the relationship between the amount of time statistics students...
 please correct red error boxes
What is the relationship between the amount of time statistics students study per week and their final exam scores! The results of the survey are shown below The ruil and alternative hypotheses for correlation are The preluet: 1.0024 Round to four decimal places c. Use a level of sigrice -0.05 to state the conclusion of the hypothesis test in the context of There la statistically significant evidence la conclude that there a carrodation between the...
please correct red error boxes
What is the relationship between the amount of time statistics students study per week and their final exam scores! The results of the survey are shown below The ruil and alternative hypotheses for correlation are The preluet: 1.0024 Round to four decimal places c. Use a level of sigrice -0.05 to state the conclusion of the hypothesis test in the context of There la statistically significant evidence la conclude that there a carrodation between the...
Retrieve the "UndergradSurvey.xds" file from the item posted in the Final Exam Week content folder (next to this Exam). Using Excel, create a multiple linear regression to predict the salary...
 Retrieve the "UndergradSurvey.xds" file from the item posted in the Final Exam Week content folder (next to this Exam). Using Excel, create a multiple linear regression to predict the salary expectation (column ) of undergraduate students using their Age (column C) and gender (column B) as the independent variables AWhat is the numeric value of the slope coefficient (b) associated with Age in this model? (Round your answer to 3 decimals). в sng the regression model fro m the previous...
 a) Find the multiple regression equation using all three explanatory variables. Assume that X1 is mid-term score, X2 is hours studying per week and x3 is hours watching television per week. Give your answers to 3 decimal places. û = mid-term score + hours studying + hours watching television + b) At a level of significance of 0.05, the result of the F test for this model is that the null hypothesis rejected. c) The explanatory variable that is most...
 A multiple regression model is to be constructed to predict the
heart rate in beats per minute (bpm) of a person based upon their
age, weight and height.
Data has been collected on 30 randomly selected individuals:
Point,Heart rate,Age,Weight,Height
1,62,22,148,74
2,57,28,105,57
3,84,52,109,70
4,120,43,211,61
5,76,38,164,62
6,72,47,109,69
7,117,49,215,73
8,115,41,259,70
9,118,59,213,61
10,65,39,114,71
11,84,53,115,67
12,99,23,258,57
13,80,30,262,64
14,76,35,123,58
15,75,41,173,74
16,104,44,161,73
17,92,53,198,60
18,61,39,122,62
19,108,42,237,65
20,69,30,214,70
21,121,52,180,57
22,94,48,136,63
23,76,43,172,72
24,65,38,134,58
25,65,20,199,60
26,82,36,187,74
27,55,26,195,70
28,64,44,114,65
29,125,55,186,58
30,116,58,212,69
1 of 7 ID: MST.MR.CM.01.0010 (14 points) A multiple regression model...
A multiple regression model is to be constructed to predict the
heart rate in beats per minute (bpm) of a person based upon their
age, weight and height.
Data has been collected on 30 randomly selected individuals:
Point,Heart rate,Age,Weight,Height
1,62,22,148,74
2,57,28,105,57
3,84,52,109,70
4,120,43,211,61
5,76,38,164,62
6,72,47,109,69
7,117,49,215,73
8,115,41,259,70
9,118,59,213,61
10,65,39,114,71
11,84,53,115,67
12,99,23,258,57
13,80,30,262,64
14,76,35,123,58
15,75,41,173,74
16,104,44,161,73
17,92,53,198,60
18,61,39,122,62
19,108,42,237,65
20,69,30,214,70
21,121,52,180,57
22,94,48,136,63
23,76,43,172,72
24,65,38,134,58
25,65,20,199,60
26,82,36,187,74
27,55,26,195,70
28,64,44,114,65
29,125,55,186,58
30,116,58,212,69
1 of 7 ID: MST.MR.CM.01.0010 (14 points) A multiple regression model...
 What is the relationship between the amount of time statistics students study per week and their final exam scores? The results of the survey are shown below. Time Score 3 10 15 512 015 58 75 89 89 77 79 54 96 a. Find the correlation coefficient: r = Round to 2 decimal places. b. The null and alternative hypotheses for correlation are: Ho: ? - 0 H: 70 (Round to four The p-value is: decimal places) c. Use a...
 A business statistics professor at a college would like to develop a regression model to predict the final exam scores for students based on their current GPS, the number of hours they studied for the exam and the number of times they were absent during the semester. The data for these variables are in the accompanying table Complete parts a through d below. ERE Click the icon to view the table of data a. Constructa regression models independent variables. Let...
 Find the equation of the regression line for the given data. Then construct a scatter plot of the data and draw the regression line. (The pair of variables have a significant correlation.) Then use the regression equation to predict the value of y for each of the given x-values, if meaningful. The number of hours 6 students spent for a test and their scores on that test are shown below. Hours spent studying, X 2 5 5 (a) x =...
 please correct red error boxes
What is the relationship between the amount of time statistics students study per week and their final exam scores! The results of the survey are shown below The ruil and alternative hypotheses for correlation are The preluet: 1.0024 Round to four decimal places c. Use a level of sigrice -0.05 to state the conclusion of the hypothesis test in the context of There la statistically significant evidence la conclude that there a carrodation between the...
please correct red error boxes
What is the relationship between the amount of time statistics students study per week and their final exam scores! The results of the survey are shown below The ruil and alternative hypotheses for correlation are The preluet: 1.0024 Round to four decimal places c. Use a level of sigrice -0.05 to state the conclusion of the hypothesis test in the context of There la statistically significant evidence la conclude that there a carrodation between the...
 Retrieve the "UndergradSurvey.xds" file from the item posted in the Final Exam Week content folder (next to this Exam). Using Excel, create a multiple linear regression to predict the salary expectation (column ) of undergraduate students using their Age (column C) and gender (column B) as the independent variables AWhat is the numeric value of the slope coefficient (b) associated with Age in this model? (Round your answer to 3 decimals). в sng the regression model fro m the previous...
Most questions answered within 3 hours.
-
Consider a 3m x 3m window in a house. The thermal conductivity
is reported to be...
asked 15 minutes ago -
Why has California been the favorite destination of large number
of secondary migrants?
asked 48 minutes ago -
Do not neglect the old for the new. The existing business must
not lose priority simply...
asked 3 hours ago -
Kylie is a single mom with two dependent children,
Tanner, age 7 and Olivia, age 11....
asked 5 hours ago -
Phosphorous + bromine = phosphorous tribromide. If 35.0 g of
bromine are reacted and 27.9 grams...
asked 6 hours ago -
Derive the long wavelength limit of the Planck energy density
distribution
asked 6 hours ago -
Calculate the pH of each of the following solutions.
0.50 M HBr
3.1×10⁻⁴ M KOH
4.2×10⁻⁵...
asked 10 hours ago -
For the year ended December 31, Depot Max’s cost of merchandise
sold was $85,600. Inventory at the...
asked 10 hours ago -
Week 10 - Professional Memo Assignment
Professional Memo Assignment
Your mission for this week, should you...
asked 10 hours ago -
Write a Python program that stores the data for each
player on the team, and it...
asked 10 hours ago -
In
the last 3 months, mike never knows when he is going to get his
allowance...
asked 10 hours ago -
Is Ca(OH)2 a Bronsted base, Lewis base, or both? Why?
asked 10 hours ago