
Homework Answers
The Aggregate supply curve depicts the quantity of goods and services an economy can produce with full employment of labor and capital.
The Aggregate demand curve is comprised of the sum of aggregate expenditures:
AD= C+I+G+NX
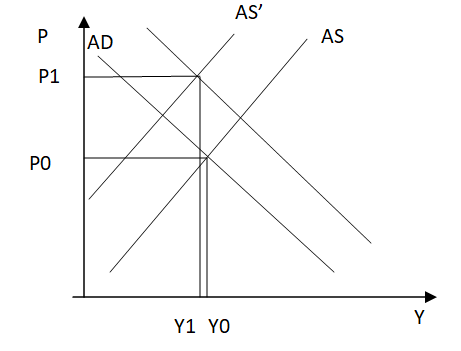
a) Increase in G with money supply held constant by Fed will lead to the increase in AD and hence will shift the AD to the right.

The initial equilibrium level was where AS and AD intersect and produce Y0 output at P0 price level. As Government expenditure increase, AD shifts to right to new AD'. The new output level is Y1 and price level is P1.
b) As the price of oil increase, it becomes more costlier to produce goods thus the supply of goods and services will fall at the given price level. Thus AS curve will shift to the left.

The AS curve will shift to AS' leading to the change in the equilibrium Price and output. The new price will be more than the old price and the new output will decline as increased prices will not be favored.
c) The Z in an economy means the demand for goods. If Z decreases with no change in government spending, it means that the AD will shift to the right due to increased demand.

Thus, once again, the AD will now shift to AD'. And new equilibrium quantities will be increase price level and increased output level than before.
d) When the price of oil increase; as explained in part b) the AS will shift to the left and now because there is also increase in Government spending, the AD will shift to the right.
Since both the AS and AD shift the price will be higher in all cases but the output level can vary depending upon by what intensity did the AD curve shifts. Thus output level can be lower than the previous level or can be higher than that depending upon the expenditure by the government.
AD' AS P AD P1 PO YO Y1
AS' P AD AS P1 PO Y1 YO
AD' AS P AD P1 PO YO Y1
AS P AD AS P1 PO Y1 YO
Add Answer to:
Illustrate each of the following sotuations woth a graph showing the aggregate supply and aggrega...
Illustrate each of the following sotuations woth a graph showing the aggregate supply and aggrega...
 Illustrate each of the following sotuations woth a graph showing
the aggregate supply and aggregate demand curves, and explain what
happens to the equilibrium value pf the price level and aggragate
output :
a) an increase in G with the money supply held constant by the
Fed
b) an increase in the price of oil with no change in
governement spendings
c) a decrease in Z with no change in governement
spending
d) an decrease in the price of oil...
Illustrate each of the following sotuations woth a graph showing
the aggregate supply and aggregate demand curves, and explain what
happens to the equilibrium value pf the price level and aggragate
output :
a) an increase in G with the money supply held constant by the
Fed
b) an increase in the price of oil with no change in
governement spendings
c) a decrease in Z with no change in governement
spending
d) an decrease in the price of oil...
Aggregate supply and aggregate demand in Lithuania were in their long run equilibrium. Then consumers decided...
Aggregate supply and aggregate demand in Lithuania were in their long run equilibrium. Then consumers decided to spend less and save more. In a well-labeled graph, show how aggregate demand, aggregate supply, and the equilibrium change in both the short and long run Explain what happened to the economy, especially the price level and output, in the short and long run . Show (in a pair of graphs) what the central bank could do to offset the decrease in consumer...
sergate supply and aggregate demand curves, illustrate and summarize what impact each of the following a...
 sergate supply and aggregate demand curves, illustrate and summarize what impact each of the following a nave on the price level and the equilibrium level of aggregate output in the short run. (a) The economy is near capacity and the government increases government spending.
I. The economy of Zarland is operating below the full-employment level of output with a balanced budget. (a) Draw a correctly labeled graph of short-run aggregate supply, long-run aggregate supply, a...
 I. The economy of Zarland is operating below the full-employment level of output with a balanced budget. (a) Draw a correctly labeled graph of short-run aggregate supply, long-run aggregate supply, and aggregate demand, and show each of the following. (Gi) The country's current equilibrium output and price level, labeled Yj and PL1. respectively (ii) The full-employment output, labeled Yf (b) Ir Zarland increases government expenditures and taxes by equal amounts, can aggregate demand increase? Explain. (c) If Zarland decides to...
Aggregate supply and aggregate demand in Lithuania were in their long run equilibrium. Then consumers decided...
Aggregate supply and aggregate demand in Lithuania were in their long run equilibrium. Then consumers decided to spend less and save more. In a well-labeled graph, show how aggregate demand, aggregate supply, and the equilibrium change in both the short and long run (6 points). Explain what happened to the economy, especially the price level and output, in the short and long run (2 points). Show (in a pair of graphs) what the central bank could do to offset the...
What reference? Name: For each of the following events, use an AD-AS diagram to show the...
 What reference?
Name: For each of the following events, use an AD-AS diagram to show the short-run and long-run effects on output and the price level (inflation rate); identify any output gap. Assume the economy starts in long run equilibrium. (1) The government reduces income taxes AS P AD (2) A decrease in consumer confidence leads to lower consumption spending AS P. AD AD-AS practice assignment.pdf 2/2 (3) The Fed decreases the money supply AS Pe K AD y* (4)...
What reference?
Name: For each of the following events, use an AD-AS diagram to show the short-run and long-run effects on output and the price level (inflation rate); identify any output gap. Assume the economy starts in long run equilibrium. (1) The government reduces income taxes AS P AD (2) A decrease in consumer confidence leads to lower consumption spending AS P. AD AD-AS practice assignment.pdf 2/2 (3) The Fed decreases the money supply AS Pe K AD y* (4)...
urves. Where on the short-run AS curve was Japan in 2000 8 By using aggregate supply...
 urves. Where on the short-run AS curve was Japan in 2000 8 By using aggregate supply and aggregate demand curves to iutratyour points, discuss the impacts of the following events on the price level and on equilibrium GDP () in the short run: d. An increase in the money supply with the economy operating at near full capacity A de crease in taxes and an increase in government spendi ng supported by a cooperative Fed acting to keep output from...
In the graph, the initial aggregate supply curve is AS and the initial aggregate demand curve...
 In the graph, the initial aggregate supply curve is AS and the initial aggregate demand curve is ADo Some events that could have changed aggregate demand from AD, to AD are O A. a fall in the exchange rate or Price level 0 AS AS an increase in expected future inflation O B. a decrease in the money wage rate or 105 10 an increase in potential GDP ( 100 C. a decrease in expected future income or a decrease...
Using the IS-LM and Aggregate Supply-Aggregate Demand (AS-AD) models of Chapter 12 with a flat short-run...
 Using the IS-LM and Aggregate Supply-Aggregate Demand (AS-AD) models of Chapter 12 with a flat short-run AS curve (that is, completely sticky prices), suppose the economy is at the natural rate of unemployment and so, at long-run equilibrium. Suddenly, taxes are reduced with no change in government spending. Tell me (or show on a graph) what happens to the IS and/or LM curves. Show on a different graph what happens on the AS-AD diagram in the short-run (drawing in the...
Which of the following are ways that the Federal Reserve influences the U.S. economy through its monetary policies?
 3. How the Fed influences the money supply Which of the following are ways that the Federal Reserve influences the U.S. economy through its monetary policies? Check all that apply. O Using open-market operations to sell securities, the Fed can increase the money supply, thereby increasing interest rates and subsequently reducing the rate of inflation. O Using open-market operations to buy securities, the Fed can increase the money supply, thereby increasing interest rates, which would cause security prices to decrease. Using open-market operations to sell...
 Illustrate each of the following sotuations woth a graph showing
the aggregate supply and aggregate demand curves, and explain what
happens to the equilibrium value pf the price level and aggragate
output :
a) an increase in G with the money supply held constant by the
Fed
b) an increase in the price of oil with no change in
governement spendings
c) a decrease in Z with no change in governement
spending
d) an decrease in the price of oil...
Illustrate each of the following sotuations woth a graph showing
the aggregate supply and aggregate demand curves, and explain what
happens to the equilibrium value pf the price level and aggragate
output :
a) an increase in G with the money supply held constant by the
Fed
b) an increase in the price of oil with no change in
governement spendings
c) a decrease in Z with no change in governement
spending
d) an decrease in the price of oil...
 sergate supply and aggregate demand curves, illustrate and summarize what impact each of the following a nave on the price level and the equilibrium level of aggregate output in the short run. (a) The economy is near capacity and the government increases government spending.
 I. The economy of Zarland is operating below the full-employment level of output with a balanced budget. (a) Draw a correctly labeled graph of short-run aggregate supply, long-run aggregate supply, and aggregate demand, and show each of the following. (Gi) The country's current equilibrium output and price level, labeled Yj and PL1. respectively (ii) The full-employment output, labeled Yf (b) Ir Zarland increases government expenditures and taxes by equal amounts, can aggregate demand increase? Explain. (c) If Zarland decides to...
 What reference?
Name: For each of the following events, use an AD-AS diagram to show the short-run and long-run effects on output and the price level (inflation rate); identify any output gap. Assume the economy starts in long run equilibrium. (1) The government reduces income taxes AS P AD (2) A decrease in consumer confidence leads to lower consumption spending AS P. AD AD-AS practice assignment.pdf 2/2 (3) The Fed decreases the money supply AS Pe K AD y* (4)...
What reference?
Name: For each of the following events, use an AD-AS diagram to show the short-run and long-run effects on output and the price level (inflation rate); identify any output gap. Assume the economy starts in long run equilibrium. (1) The government reduces income taxes AS P AD (2) A decrease in consumer confidence leads to lower consumption spending AS P. AD AD-AS practice assignment.pdf 2/2 (3) The Fed decreases the money supply AS Pe K AD y* (4)...
 urves. Where on the short-run AS curve was Japan in 2000 8 By using aggregate supply and aggregate demand curves to iutratyour points, discuss the impacts of the following events on the price level and on equilibrium GDP () in the short run: d. An increase in the money supply with the economy operating at near full capacity A de crease in taxes and an increase in government spendi ng supported by a cooperative Fed acting to keep output from...
 In the graph, the initial aggregate supply curve is AS and the initial aggregate demand curve is ADo Some events that could have changed aggregate demand from AD, to AD are O A. a fall in the exchange rate or Price level 0 AS AS an increase in expected future inflation O B. a decrease in the money wage rate or 105 10 an increase in potential GDP ( 100 C. a decrease in expected future income or a decrease...
 Using the IS-LM and Aggregate Supply-Aggregate Demand (AS-AD) models of Chapter 12 with a flat short-run AS curve (that is, completely sticky prices), suppose the economy is at the natural rate of unemployment and so, at long-run equilibrium. Suddenly, taxes are reduced with no change in government spending. Tell me (or show on a graph) what happens to the IS and/or LM curves. Show on a different graph what happens on the AS-AD diagram in the short-run (drawing in the...
Most questions answered within 3 hours.
-
if we subtract 1000 from 0001 is there overflow? (binary)
asked 1 minute ago -
Hello, I need help with the function below, The language I am
using is Ocaml
open...
asked 2 minutes ago -
Explain how the presence of glucose represses the gal structural
genes?
asked 10 minutes ago -
For the reaction CaI2+2AgNO3⟶2AgI+Ca(NO3)2 how many grams of
silver iodide, AgI, are produced from 56.5 g...
asked 21 minutes ago -
Write an equation for hydrolysis via acid catalysis.
Using ethyl acetate, ethyl benzoate, ethyl formate or...
asked 29 minutes ago -
Only one graph is needed.
(a) Draw a Supply Curve and the Demand Curve for the...
asked 32 minutes ago -
Fill in the blanks and please show how you arrived at numerical
answers
. The...
asked 32 minutes ago -
91. If the half – life of a sample of radioactive
material is 60 days, what...
asked 39 minutes ago -
White light (380nm-750nm) strikes a diffraction grating (420
lines/mm) at normal incidence. What is the highest-order...
asked 49 minutes ago -
1) Explain what is meant by a good being "excludable."?
2) Explain what is meant by...
asked 48 minutes ago -
I need help with this question:
Describe in detail at least two factors that stimulated American...
asked 56 minutes ago -
Calculate the Boyle temperature for helium assuming it follows
the Berthelot equation of state.
asked 56 minutes ago