


Homework Answers
1) Govt Reducing Income tax----

Reducing income tax increases disposable income of Consumers and increases AD ( C is part of AD).It will shift AD towards right.
Real gdp Increases
Price level rises
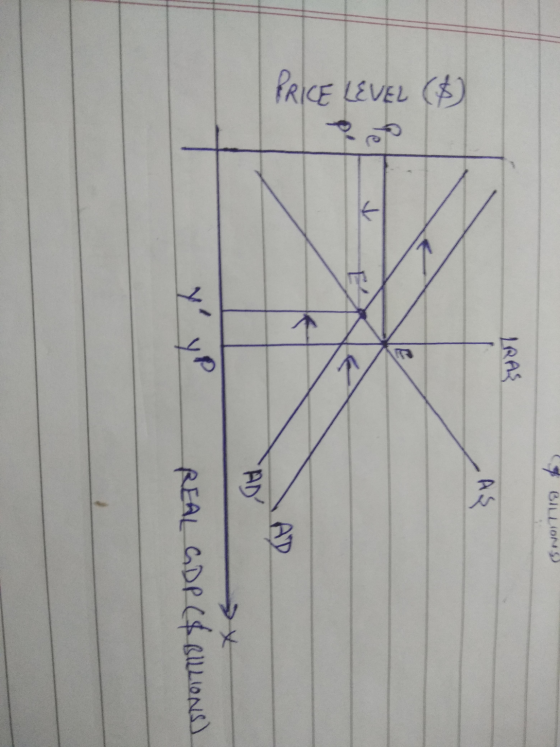
2) Decrease in Consumers confidence leading to lesser Consumption spending

Decrease in consumption leads to leftward shift of AD curve as C is a component of AD.
It will decrease real gdp anc price level
3) Fed decreases the money supply
When fed decreases money supply under inflationary Monetary policy, it reduces borrowing by investors anc consumers,which leads to leftward shift of AD curvr
Real gdp = decreases
Price level falls
4)Oil prices drop sharply

With the sharp fall oin oil prices ,the short run AS curve will shift rightward due to decrease in production cost
Equilibrium real gdp will rise
Price level will fall
Add Answer to:
What reference?
Name: For each of the following events, use an AD-AS diagram to show the...
Inflationary pressure in the AS-AD model can be shown as a leftward shift of the AD...
Inflationary pressure in the AS-AD model can be shown as a leftward shift of the AD curve when the economy is already producing at its potential GDP. supply shock that shifts the AS to the right. rightward shift of the AD curve when the economy is already producing at its potential GDP. Typically, if consumer and business confidence is high then ________ and if consumer and business confidence is low then ________. AD shifts to the left; AD shifts to...
Which of the following statements best describes how economic growth is represented i n the AD/AS...
Which of the following statements best describes how economic growth is represented i n the AD/AS diagram? In the AD/AS diagram, long-run economic growth due to productivity increases over time will be represented by a gradual shift to the right of aggregate supply. In the AD/AS diagram, short-run economic growth due to productivity increases over time will be represented by a dramatic shift to the right of aggregate supply. In the AD/AS diagram, short-run economic growth due to productivity increases...
As prices rise, a fixed money supply will be able to buy fewer goods and services....
As prices rise, a fixed money supply will be able to buy fewer goods and services. This real balance effect is due to a(n) reduction in the interest rate. Increase in aggregate demand Decline in the purchasing power of the fixed quantity of money. Increase in income. The international substitution effect exists because a Higher price level will reduce interest rates and stimulate foreign investment. Lower price level will make domestically produced goods less expensive relative to foreign goods. Higher...
Aggregate Demand (AD) & Aggregate Supply Start each # scenario at equilibrium and full employment (Q),...
 Aggregate Demand (AD) & Aggregate Supply Start each # scenario at equilibrium and full employment (Q), determine what curve shifts and the impact.T Economic ChangeH WhichDoes the curve shifts?Increase or unemployment, inflation, Does this shift cause a problem of curve AD or AS Decrease? neither or both? 14 Real Interest Rates Decrease 2 Substantial immigration occurs 3A Citizens Pay off Debt*i 4 Better Trained workforce increases ncreasing labor supply productivityH 5Excess Capacity increasest 64Increase by the government in Business 7H...
Answer these 4 will rate after Graphically, a negative supply shock, such as the increase in...
 Answer these 4 will rate after
Graphically, a negative supply shock, such as the increase in oil prices in 1973, can be shown as: O a leftward shift of the AD curve. a downward and to the right shift of the SR-AS curve. an upward and to the left shift of SR-AS curve. O a rightward shift of the AD curve. Decreases in short-run aggregate supply due to a reduction in the nation's resources result in O an increase in...
Answer these 4 will rate after
Graphically, a negative supply shock, such as the increase in oil prices in 1973, can be shown as: O a leftward shift of the AD curve. a downward and to the right shift of the SR-AS curve. an upward and to the left shift of SR-AS curve. O a rightward shift of the AD curve. Decreases in short-run aggregate supply due to a reduction in the nation's resources result in O an increase in...
5) If consumption increases by $200 and, in response, equilibrium aggregate expenditure increases by $600, the...
 5) If consumption increases by $200 and, in response, equilibrium aggregate expenditure increases by $600, the multiplier is A) 5 B) 0.5.C)2. D) 0.3. 6) When the GDP in Kuwait rises relative to the GDP in other countries, will fall and will fall A) exports; imports B) exports; net exports C) imports; net exports D) net exports; imports 7) An increase in the price level will A) shift the aggregate demand curve to the left. B) shift the aggregate demand...
O For each shock identified below, Shift the AD curve, the SRAS Curve, or both to...
 O For each shock identified below, Shift the AD curve, the SRAS Curve, or both to show its effects on aggregate demand and/or aggregate Supply then move Point o to the new short-run equilibrium to indicate the new Price Level P and output y. Assume the economy Starts out in a long-run equilibrium. decrease in the velocity a) An exogenous of money. b) An exogenous of oil. Increase in the Price Now consider how the goals of the Fed influence...
2. Use an AD-AS diagram to analyze how each of the following economic scenarios will affect...
 2. Use an AD-AS diagram to analyze how each of the following economic scenarios will affect Y and P in both the short run and in the long run. In each case, begin with the assumption that Y is at its potential level YP, Be sure to indicate clearly in your diagram which curves shift and in what direction they shift (in both the short run and the long run.) Cle) (a) There is a increase in consumer confidence in...
During the winter of 2014/2015 oil prices dropped by a large percentage compared to the summer of 2014
During the winter of 2014/2015 oil prices dropped by a large percentage compared to the summer of 2014. By March 2015, what changed?There was a shift to the right in the aggregate demand curve.There was a shift to the left in the aggregate demand curve.There was a shift to the right in the aggregate supply curve.If the government saw that consumer confidence was high, what step can it take to shift the AD to the left?The Federal Reserve can increase...
Which would most likely shift the aggregate supply curve? A change in the prices of _____....
Which would most likely shift the aggregate supply curve? A change in the prices of _____. domestic products foreign products financial assets resources A decrease in aggregate demand in the short run will reduce _____. both real output and the price level the price level and increase the real domestic output the real domestic output and have no effect on the price level the price level and have no effect on real domestic output The economy's long-run AS curve assumes...
 Aggregate Demand (AD) & Aggregate Supply Start each # scenario at equilibrium and full employment (Q), determine what curve shifts and the impact.T Economic ChangeH WhichDoes the curve shifts?Increase or unemployment, inflation, Does this shift cause a problem of curve AD or AS Decrease? neither or both? 14 Real Interest Rates Decrease 2 Substantial immigration occurs 3A Citizens Pay off Debt*i 4 Better Trained workforce increases ncreasing labor supply productivityH 5Excess Capacity increasest 64Increase by the government in Business 7H...
 Answer these 4 will rate after
Graphically, a negative supply shock, such as the increase in oil prices in 1973, can be shown as: O a leftward shift of the AD curve. a downward and to the right shift of the SR-AS curve. an upward and to the left shift of SR-AS curve. O a rightward shift of the AD curve. Decreases in short-run aggregate supply due to a reduction in the nation's resources result in O an increase in...
Answer these 4 will rate after
Graphically, a negative supply shock, such as the increase in oil prices in 1973, can be shown as: O a leftward shift of the AD curve. a downward and to the right shift of the SR-AS curve. an upward and to the left shift of SR-AS curve. O a rightward shift of the AD curve. Decreases in short-run aggregate supply due to a reduction in the nation's resources result in O an increase in...
 5) If consumption increases by $200 and, in response, equilibrium aggregate expenditure increases by $600, the multiplier is A) 5 B) 0.5.C)2. D) 0.3. 6) When the GDP in Kuwait rises relative to the GDP in other countries, will fall and will fall A) exports; imports B) exports; net exports C) imports; net exports D) net exports; imports 7) An increase in the price level will A) shift the aggregate demand curve to the left. B) shift the aggregate demand...
 O For each shock identified below, Shift the AD curve, the SRAS Curve, or both to show its effects on aggregate demand and/or aggregate Supply then move Point o to the new short-run equilibrium to indicate the new Price Level P and output y. Assume the economy Starts out in a long-run equilibrium. decrease in the velocity a) An exogenous of money. b) An exogenous of oil. Increase in the Price Now consider how the goals of the Fed influence...
 2. Use an AD-AS diagram to analyze how each of the following economic scenarios will affect Y and P in both the short run and in the long run. In each case, begin with the assumption that Y is at its potential level YP, Be sure to indicate clearly in your diagram which curves shift and in what direction they shift (in both the short run and the long run.) Cle) (a) There is a increase in consumer confidence in...
Most questions answered within 3 hours.
-
Discuss the benefits and detriments of hard water, and your
opinion on using water softeners.
asked 24 minutes ago -
For a Friedel-Crafts alkylation reaction between
1,4-dimethoxybenzene with 3-methyl-2-butanol and sulfuric acid what
product was formed...
asked 3 minutes ago -
This programming assignment needs to be written so that it can
do infix expression to postfix...
asked 9 minutes ago -
Below are the reduction half reactions for chemolithoautotrophic
denitrification, where hydrogen is a source of electrons...
asked 9 minutes ago -
On January 2, 2020, the Retail Auto Parts Company received a
notice from its primary supplier...
asked 18 minutes ago -
An electron of kinetic energy 13.0 keV moves in a circular orbit
perpendicular to a magnetic...
asked 22 minutes ago -
1. Explain how a fractionating column increases the separation
of two liquids.
2. What is an...
asked 23 minutes ago -
One of two hydrogen atoms has electrons at n = 1 Bohr orbit
while the other...
asked 25 minutes ago -
On January 1, Year 1, Sheffield Co. issued bonds with a face
value of $200,000, a...
asked 36 minutes ago -
Write a short application that computes the perimeter of a
rectangle. It should allow the user...
asked 36 minutes ago -
An inventory of Product A has to be maintained at NiceCare using
the EOQ model, based...
asked 44 minutes ago -
Define the 2
24.Moral Imperialism
25.Selective Service Act
26.Tulsa Riot
27.Red Scare
28.League of Nations
29....
asked 53 minutes ago