For this question, you are required to find the standard deviation for a set of data. The answer ...
For this question, you are required to find the standard deviation for a set of data. The answer alone will not achieve full marks. There are many tools available to calculate the standard deviation. Here you are required to use several of the tools and show your working out to earn the marks. The data is the test results of 21 students who sat a mathematics quiz worth 100 marks.
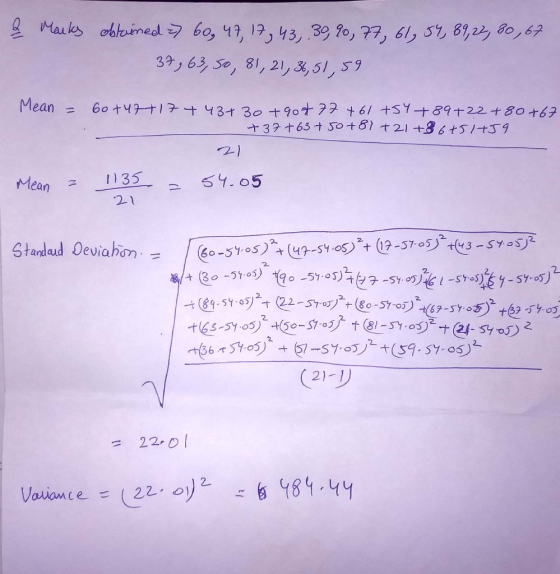
Results: 60, 47, 17, 43, 30, 90, 77, 61, 54, 89, 22, 80, 67, 37, 63, 50, 81, 21, 36, 51, 59.
a) Calculate the mean and variance and standard deviation using a scientific calculator.
b) Calculate the standard deviation by long hand showing all workings step-by-step.
c) Set up a spreadsheet to calculate the standard deviation. Insert a screen shot or snip to show the data and the answer.
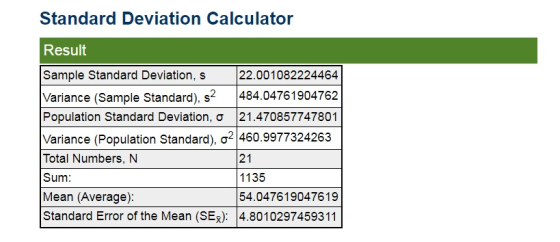
d) Use an on-line calculator to find the mean, variance and standard deviation of the data. Insert a screen shot or snip to show the three answers.
Homework Answers
b)
c)

d)
Add Answer to:
For this question, you are required to find the standard deviation for a set of data. The answer ...
Question 8: (12 marks) For this question you are required to find the standard deviation for...
Question 8: (12 marks) For this question you are required to find the standard deviation for a set of data. The answer alone will not achieve full marks. There are many tools available to calculate the standard deviation. Here you are required to use several of the tools and show your working out to earn the marks. The data is the test results of 21 students who sat a mathematics quiz worth 100 marks. Results: 60, 47, 17, 43, 30,...
Calculate the sample standard deviation for this data set: 58,60, 74
 Calculate the sample standard deviation for this data set: 58,60, 74. The formula for the sample standard deviation is shown, where n represents the sample size, x represents each value in the data set, and x represents the sample mean.\(s=\sqrt{\frac{\sum(x-\bar{x})^{2}}{n-1}}\)Step 1. Calculate the sample mean. Step 2. Calculate the deviations and the squares of the deviations. Step 3. Calculate the sample variance and the sample standard deviation. Provide your sample standard deviation answer precise to oñe decimal place
Calculate the sample standard deviation for this data set: 58, 60, 74. The formula for the...
 Calculate the sample standard deviation for this data set: 58, 60, 74. The formula for the sample standard deviation is shown, where n represents the sample size, x represents each value in the data set, and X represents the sample mean. 2(x-x) n- Step 1. Calculate the sample mean. x=164 Step 2. Calculate the deviations and the squares of the deviations deviation of 58 - square of deviation of 58- deviation of 60 square of deviation of 60- deviation of...
Calculate the sample standard deviation for this data set: 11, 28, 36. The formula for the...
Calculate the sample standard deviation for this data set: 11, 28, 36. The formula for the sample standard deviation is shown, where ?n represents the sample size, ?x represents each value in the data set, and ?⎯⎯⎯x¯ represents the sample mean. ?=∑(?−?⎯⎯⎯)2?−1‾‾‾‾‾‾‾‾‾‾‾‾√s=∑(x−x¯)2n−1 Step 1. Calculate the sample mean. ?⎯⎯⎯x¯ = Step 2. Calculate the deviations and the squares of the deviations. deviation of 11= square of deviation of 11= deviation of 28= square of deviation of 28= deviation of 36=...
Calculate the sample standard deviation for this data set: 88, 73, 91·The formula for the sample...
 Calculate the sample standard deviation for this data set: 88, 73, 91·The formula for the sample standard deviation is where n represents the sample size, x represents each value in the data set, and represents the sample mean. \(s=\sqrt{\frac{\sum(x-\bar{x})^{2}}{n-1}}\)Step 1. Calculate the sample mean.Step 2. Calculate the deviations and the squares of the deviations. Step 3. Calculate the sample variance and the sample standard deviation. Provide your sample standard deviation answer precise to one decimal place.
Calculate the sample standard deviation for this data set: 88, 73, 91. The formula for the...
 Calculate the sample standard deviation for this data set: 88, 73, 91. The formula for the sample standard deviation is shown, where n represents the sample size, x represents each value in the data set, and x represents the sample mean. Σ(x-x)" n-1 Step 1. Calculate the sample mean. Step 2. Calculate the deviations and the squares of the deviations. deviation of 88 = square of deviation of 88- deviation of 73 - square of deviation of 73
#4 (4a) You have a data set with a mean of 50 and a standard deviation...
 #4 (4a) You have a data set with a mean of 50 and a standard deviation of 10. If you add 3 to every data point, what will be the new values for the mean and standard deviation. Briefly explain your answer. (4b) The standardized score for the minimum of a data set is Zmin median is zmed = -0.6, and the standardized score the maximum of the data set is zmin +6.8. Based on this information alone, describe the...
Suppose you have a data set and the mean, median and the standard deviation are 10,...
Suppose you have a data set and the mean, median and the standard deviation are 10, 10 and 2, respectively. Someone multiplies all your data points by 3. Call these data the new data. The mean of the new data will be _______________________ The Median of the new data will be _______________________ The standard deviation of the new will be _______________________ The variance of the new will be _______________________––
4- Variance and Standard deviation (how far the data values lie from the mean) The mean,...
 4- Variance and Standard deviation (how far the data values lie from the mean) The mean, mode, and median do a nice job in telling where the center of the data set is, but often we are interested in more. For example, a pharmaceutical engineer develops a new drug that regulates iron in the blood. Suppose she finds out that the average sugar content after taking the medication is the optimal level. This does not mean that the drug is...
- Which statistical test indicates the precision of the measured data set? A) mean B)Standard Deviation...
- Which statistical test indicates the precision of the measured data set? A) mean B)Standard Deviation C) Q-test D)Accuracy - Keeping or rejecting the 52 mg measurement (depending on the results of the Q-test), calculate the mean of the modified data set. (Report answer to 1 decimal place and with NO units.) - Calculate the estimated standard deviation of the modified data set. (Report to 1 decimal place and with NO units.)
 Calculate the sample standard deviation for this data set: 58, 60, 74. The formula for the sample standard deviation is shown, where n represents the sample size, x represents each value in the data set, and X represents the sample mean. 2(x-x) n- Step 1. Calculate the sample mean. x=164 Step 2. Calculate the deviations and the squares of the deviations deviation of 58 - square of deviation of 58- deviation of 60 square of deviation of 60- deviation of...
 Calculate the sample standard deviation for this data set: 88, 73, 91. The formula for the sample standard deviation is shown, where n represents the sample size, x represents each value in the data set, and x represents the sample mean. Σ(x-x)" n-1 Step 1. Calculate the sample mean. Step 2. Calculate the deviations and the squares of the deviations. deviation of 88 = square of deviation of 88- deviation of 73 - square of deviation of 73
 #4 (4a) You have a data set with a mean of 50 and a standard deviation of 10. If you add 3 to every data point, what will be the new values for the mean and standard deviation. Briefly explain your answer. (4b) The standardized score for the minimum of a data set is Zmin median is zmed = -0.6, and the standardized score the maximum of the data set is zmin +6.8. Based on this information alone, describe the...
 4- Variance and Standard deviation (how far the data values lie from the mean) The mean, mode, and median do a nice job in telling where the center of the data set is, but often we are interested in more. For example, a pharmaceutical engineer develops a new drug that regulates iron in the blood. Suppose she finds out that the average sugar content after taking the medication is the optimal level. This does not mean that the drug is...
Most questions answered within 3 hours.
-
What is the source of information from natural materials which
can be used to reconstruct climate...
asked 3 minutes ago -
The International Monetary Fund (IMF) has hired you as an
economist. Your assignment is to travel...
asked 7 minutes ago -
Brief Exercise 12-65
Profitability Ratios
Tinker Corporation operates in the highly competitive consulting
industry. Tinker's balance...
asked 33 minutes ago -
Consider Lewin's three-step process. Which of the three steps do
you thin would be hardest to...
asked 33 minutes ago -
A disabled tanker leaks kerosene (n = 1.20) into the
Persian Gulf, creating a large slick...
asked 46 minutes ago -
5. Explain the condition for a DC motor to develop the
maximum power. If a DC...
asked 1 hour ago -
Compute the p[Ag] after 35.00 mL of 0.1 M silver nitrate has been
added to the...
asked 1 hour ago -
Walgreen Company (NYSE: WAG) is currently trading at $48.50 on
the NYSE. Walgreen Company is also...
asked 1 hour ago -
Based on historical data, your team knows what proportion of the
company's orders come from Males...
asked 1 hour ago -
8. Which of the following atoms has the largest magnitude
electron affinity?
(a) Sodium (Na)
(b)...
asked 1 hour ago -
Assess the two types of tests of cognitive abilities. (
regarding HR course)
asked 1 hour ago -
1.Write an inspiring vision statement for an organization where
you work or have worked. If the...
asked 1 hour ago