


ndividuals Annual Salaries by Union Status Annual Salary Annual Salary f Members Members
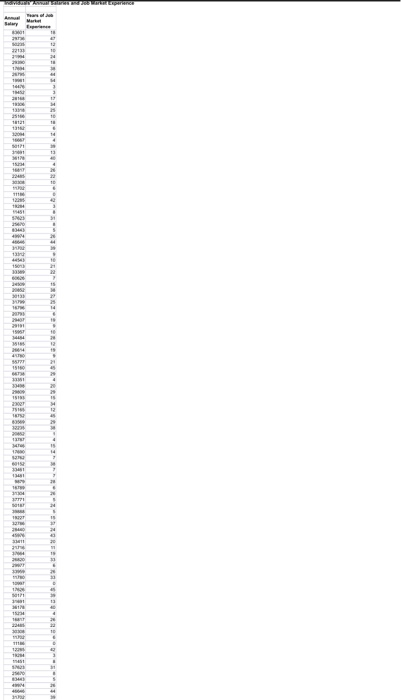
Question 3(5 points) Part (a) Using the "Experience and Income.xlsx" file, determine the sample correlation coefficient between the annual salary and the job market experience variables. You must submit your actual Excel file with the output as part of the assignment. Part (b)(2 points) Interpret the sample correlation coefficient you found in part (a). (1 point) Part (c) If we regressed income on experience, what share of the variation in income could be explained by the variation in (2 points) experience? Explain how you found your answer.
ndividuals' Annual Salaries by Union Status Annual Salary Annual Salary of of Union Members Non-Union Members 1254015 75352 5 33199.5 28959 19977 19743 26341 0192 5 99715 21714 29178 74961 34540.5 28128 0191.5 37749 271815 48141 0938.5 54267 22851 74961 337275 45462 17553 16779 18427 5 71765 864345 125164 5 47553 1908 66814 225195 50083 90939 367635 31278 451995 25194 11895 441105 239355 51726 527775 62670 22740 100107 50247 447135 227895 127475 125353.5
18 38 44 54 33 17 34 25 10 18 6 4 4 39 13 40 4 26 22 10 6 0 42 38 31 8 5 26 44 39 9 10 21 22ア15 38 27 25 4 6 9 9 10 28 2 9 9 21 45 29 4 20 29 15 34 12 45 29 14 15 14ァ38ァァ28 6 26 5
Homework Answers
Add Answer to:
Question 2 refers to the chart of numbers please show work and attach files if could sor...
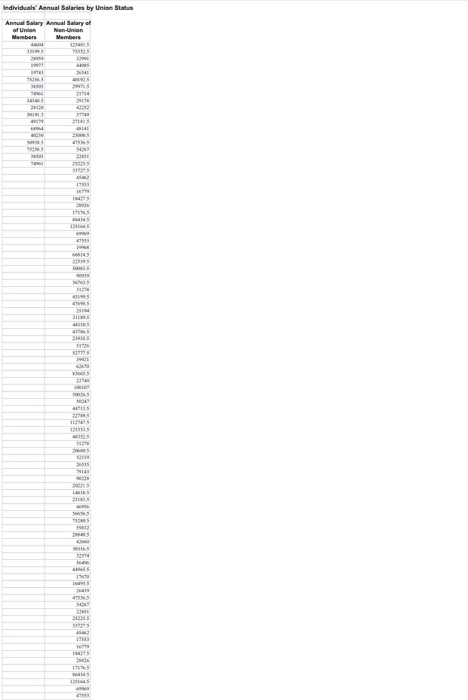
Part (a) Open the "Union Status and Income. xlsx" file that is posted with the assignment. In ord...
part (a) Open the "Union Status and Income. xlsx" file that is posted with the assignment. In order to test whether there is a difference in the variance of income between Union members and non-Union members, use Excel to carry out an "F-Test: Two-Sample for variances" with Alpha =0.05 part (b) Still using the "Union Status and Income .xlsx" file, carry out a t-test in excel (with Alpha=0.05) that tests whether there is a difference in mean income between Union...
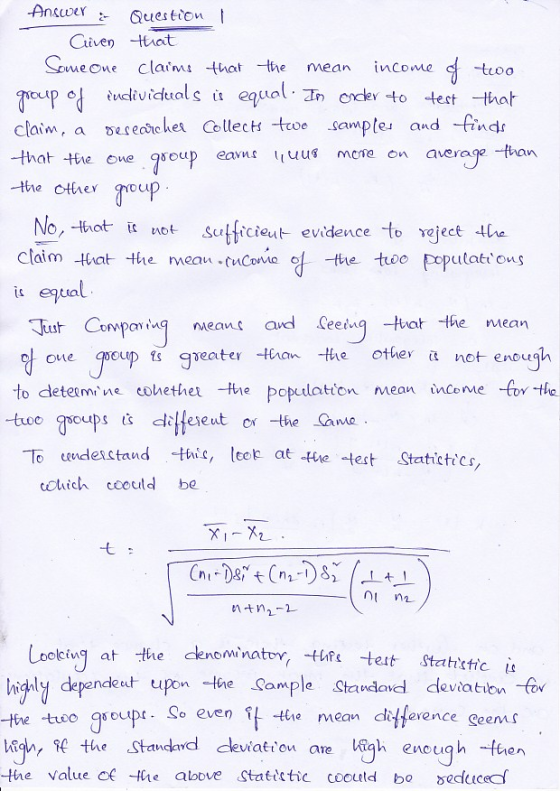
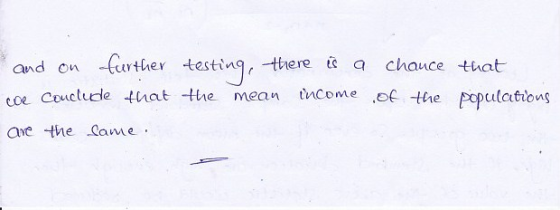
Please help with hypothesis problem! Will be happy to rate you!! :) A researcher wants to...
 Please help with hypothesis problem! Will be happy to rate
you!! :)
A researcher wants to study the relationship between salary and gender. She randomly selects 400 individuals and determines their salary and gender. Can the researcher conclude that salary and gender are dependent? Income Male Female Total Below $25,000 50 38 88 $25,000 $50,000 38 3 69 $50,000-$75,000 50 85135 Above $75,000 46 108 2001 200 400 Total Copy Data Step 1 of 8: State the null and alternative...
Please help with hypothesis problem! Will be happy to rate
you!! :)
A researcher wants to study the relationship between salary and gender. She randomly selects 400 individuals and determines their salary and gender. Can the researcher conclude that salary and gender are dependent? Income Male Female Total Below $25,000 50 38 88 $25,000 $50,000 38 3 69 $50,000-$75,000 50 85135 Above $75,000 46 108 2001 200 400 Total Copy Data Step 1 of 8: State the null and alternative...
a. The question that you are seeking to answer with the hypothesis test (e.g., Do we...
 a. The question that you are seeking to answer with the
hypothesis test (e.g., Do we have evidence to conclude that mean
spending has declined?)
b. The null and alternative hypotheses (in words as well as
using symbols)
c. The level of significance
d. The procedure to be used (e.g., Mean: population standard
deviation known)
e. Excel output (copy and paste from Excel into your
word-processed document)
f. The value of the test statistic
g. The critical value
h. The...
a. The question that you are seeking to answer with the
hypothesis test (e.g., Do we have evidence to conclude that mean
spending has declined?)
b. The null and alternative hypotheses (in words as well as
using symbols)
c. The level of significance
d. The procedure to be used (e.g., Mean: population standard
deviation known)
e. Excel output (copy and paste from Excel into your
word-processed document)
f. The value of the test statistic
g. The critical value
h. The...
Show all of your work in each question. In parts (d), (e), and (g) make sure...
Show all of your work in each question. In parts (d), (e), and (g) make sure to set up your null and alternative hypotheses and write your conclusions. Also, please round your numbers to 2 decimal points. Write legibly and neatly. You can use p-value approach or critical-value approach in writing the conclusions of your hypotheses. A large firm employing tens of thousands of workers has been accused of discriminating against its female managers. The accusation is based on a...
*** do not solve the question *** i have uploaded the data to matlab, show how do i code to run t...
 *** do not solve the question
*** i have uploaded the data to matlab, show how do i
code to run ttest for this question (provide exact
codes)
THxxxxxxxxxxxxxxxxxxxxxxxxx
stion 18 marks In a study concerned with the effects of smoking on blood pressure, the smoking status (Yes- 1, No -0) and systolic blood pressure (mmHg) were recorded for 500 randomly selected people. The purpose of the following analysis is to determine whether the systolic blood pressure of smokers is...
*** do not solve the question
*** i have uploaded the data to matlab, show how do i
code to run ttest for this question (provide exact
codes)
THxxxxxxxxxxxxxxxxxxxxxxxxx
stion 18 marks In a study concerned with the effects of smoking on blood pressure, the smoking status (Yes- 1, No -0) and systolic blood pressure (mmHg) were recorded for 500 randomly selected people. The purpose of the following analysis is to determine whether the systolic blood pressure of smokers is...
I literally have no idea what I’m doing. Help!!! Please show work!! Write an essay using...
 I literally have no idea what I’m doing. Help!!! Please show
work!!
Write an essay using Word and post it as an attachment to the discussion. Cover the following points. Choose a data set from Stat Disk using one of the following files from 13th Edition Elementary Statistics: Oscar Winner Freshman 15 Word Count Garbage Weights Passive and Active Smoke If the file contains more than one variable, choose a quantitative variable. Create a histogram using your chosen variable and...
I literally have no idea what I’m doing. Help!!! Please show
work!!
Write an essay using Word and post it as an attachment to the discussion. Cover the following points. Choose a data set from Stat Disk using one of the following files from 13th Edition Elementary Statistics: Oscar Winner Freshman 15 Word Count Garbage Weights Passive and Active Smoke If the file contains more than one variable, choose a quantitative variable. Create a histogram using your chosen variable and...
Please show me the work and formulas in the assigned cells. Thank you. C D E...
 Please show me the work and formulas in the assigned cells.
Thank you.
C D E On the cell B5 enter your PV, on cell B6 the annual retum rate on cell B7 the months of the year, and on the cell B9 calculate the monthly rate. On column C have the years, on column D the months of the year and on column E the periods. Calculate on column F the amount that you will have in your account...
Please show me the work and formulas in the assigned cells.
Thank you.
C D E On the cell B5 enter your PV, on cell B6 the annual retum rate on cell B7 the months of the year, and on the cell B9 calculate the monthly rate. On column C have the years, on column D the months of the year and on column E the periods. Calculate on column F the amount that you will have in your account...
Please show the way by Excel Data Analysis Tool Mike Wilde is president of the teachers’ union for Otsego School Distri...
Please show the way by Excel Data Analysis Tool Mike Wilde is president of the teachers’ union for Otsego School District. In preparing for upcoming negotiations, he is investigating the salary structure of classroom teachers in the district. He believes there are three factors that affect a teacher’s salary: years of experience, a teaching effectiveness rating given by the principal, and whether the teacher has a master’s degree. A random sample of 20 teachers resulted in the FILE4. Develop a...
Comparing two means: When drink drove a student to statistics (Rubric included) Instructions For this assignment,...
Comparing two means: When drink drove a student to statistics (Rubric included) Instructions For this assignment, you review this week’s Learning Resources and then perform a two-sample independent t test and an ANOVA related to the dataset that was utilized in the week 2 SPSS application assignment. Import the data into SPSS; or, if you correctly saved the data file in Week 2, you may open and use that saved file to complete this assignment. Type your answers to all...
Appreciate the process in detail and the matlab code please leave an email address ,I will send i...
 appreciate the process in detail and the matlab
code
please leave an email address ,I will send it to
you
Question 1 8 marks In a study concerned with the effects of smoking on blood pressure, the smoking status (Yes 1, No-0) and systolic blood pressure (mmHg) were recorded for 500 randomly selected people. The purpose of the following analysis is to wetermine whether the systolic blood pressure of smokers is significantly different from that of non-smokers. The data are...
appreciate the process in detail and the matlab
code
please leave an email address ,I will send it to
you
Question 1 8 marks In a study concerned with the effects of smoking on blood pressure, the smoking status (Yes 1, No-0) and systolic blood pressure (mmHg) were recorded for 500 randomly selected people. The purpose of the following analysis is to wetermine whether the systolic blood pressure of smokers is significantly different from that of non-smokers. The data are...
 Please help with hypothesis problem! Will be happy to rate
you!! :)
A researcher wants to study the relationship between salary and gender. She randomly selects 400 individuals and determines their salary and gender. Can the researcher conclude that salary and gender are dependent? Income Male Female Total Below $25,000 50 38 88 $25,000 $50,000 38 3 69 $50,000-$75,000 50 85135 Above $75,000 46 108 2001 200 400 Total Copy Data Step 1 of 8: State the null and alternative...
Please help with hypothesis problem! Will be happy to rate
you!! :)
A researcher wants to study the relationship between salary and gender. She randomly selects 400 individuals and determines their salary and gender. Can the researcher conclude that salary and gender are dependent? Income Male Female Total Below $25,000 50 38 88 $25,000 $50,000 38 3 69 $50,000-$75,000 50 85135 Above $75,000 46 108 2001 200 400 Total Copy Data Step 1 of 8: State the null and alternative...
 a. The question that you are seeking to answer with the
hypothesis test (e.g., Do we have evidence to conclude that mean
spending has declined?)
b. The null and alternative hypotheses (in words as well as
using symbols)
c. The level of significance
d. The procedure to be used (e.g., Mean: population standard
deviation known)
e. Excel output (copy and paste from Excel into your
word-processed document)
f. The value of the test statistic
g. The critical value
h. The...
a. The question that you are seeking to answer with the
hypothesis test (e.g., Do we have evidence to conclude that mean
spending has declined?)
b. The null and alternative hypotheses (in words as well as
using symbols)
c. The level of significance
d. The procedure to be used (e.g., Mean: population standard
deviation known)
e. Excel output (copy and paste from Excel into your
word-processed document)
f. The value of the test statistic
g. The critical value
h. The...
 *** do not solve the question
*** i have uploaded the data to matlab, show how do i
code to run ttest for this question (provide exact
codes)
THxxxxxxxxxxxxxxxxxxxxxxxxx
stion 18 marks In a study concerned with the effects of smoking on blood pressure, the smoking status (Yes- 1, No -0) and systolic blood pressure (mmHg) were recorded for 500 randomly selected people. The purpose of the following analysis is to determine whether the systolic blood pressure of smokers is...
*** do not solve the question
*** i have uploaded the data to matlab, show how do i
code to run ttest for this question (provide exact
codes)
THxxxxxxxxxxxxxxxxxxxxxxxxx
stion 18 marks In a study concerned with the effects of smoking on blood pressure, the smoking status (Yes- 1, No -0) and systolic blood pressure (mmHg) were recorded for 500 randomly selected people. The purpose of the following analysis is to determine whether the systolic blood pressure of smokers is...
 I literally have no idea what I’m doing. Help!!! Please show
work!!
Write an essay using Word and post it as an attachment to the discussion. Cover the following points. Choose a data set from Stat Disk using one of the following files from 13th Edition Elementary Statistics: Oscar Winner Freshman 15 Word Count Garbage Weights Passive and Active Smoke If the file contains more than one variable, choose a quantitative variable. Create a histogram using your chosen variable and...
I literally have no idea what I’m doing. Help!!! Please show
work!!
Write an essay using Word and post it as an attachment to the discussion. Cover the following points. Choose a data set from Stat Disk using one of the following files from 13th Edition Elementary Statistics: Oscar Winner Freshman 15 Word Count Garbage Weights Passive and Active Smoke If the file contains more than one variable, choose a quantitative variable. Create a histogram using your chosen variable and...
 Please show me the work and formulas in the assigned cells.
Thank you.
C D E On the cell B5 enter your PV, on cell B6 the annual retum rate on cell B7 the months of the year, and on the cell B9 calculate the monthly rate. On column C have the years, on column D the months of the year and on column E the periods. Calculate on column F the amount that you will have in your account...
Please show me the work and formulas in the assigned cells.
Thank you.
C D E On the cell B5 enter your PV, on cell B6 the annual retum rate on cell B7 the months of the year, and on the cell B9 calculate the monthly rate. On column C have the years, on column D the months of the year and on column E the periods. Calculate on column F the amount that you will have in your account...
 appreciate the process in detail and the matlab
code
please leave an email address ,I will send it to
you
Question 1 8 marks In a study concerned with the effects of smoking on blood pressure, the smoking status (Yes 1, No-0) and systolic blood pressure (mmHg) were recorded for 500 randomly selected people. The purpose of the following analysis is to wetermine whether the systolic blood pressure of smokers is significantly different from that of non-smokers. The data are...
appreciate the process in detail and the matlab
code
please leave an email address ,I will send it to
you
Question 1 8 marks In a study concerned with the effects of smoking on blood pressure, the smoking status (Yes 1, No-0) and systolic blood pressure (mmHg) were recorded for 500 randomly selected people. The purpose of the following analysis is to wetermine whether the systolic blood pressure of smokers is significantly different from that of non-smokers. The data are...
Most questions answered within 3 hours.
-
If a block of Si is doped with 10^17 Boron atom/cm^3 and 5X10^16
Arsenic atoms/cm^3,
(a)...
asked 14 minutes ago -
Why would natural selection not minimize costs (in the form of
symptoms) of evolved defenses? (choose...
asked 31 minutes ago -
What is true about a critical task?
Latest finish time - latest start time = 0...
asked 34 minutes ago -
A company uses a
process costing system. Its Assembly Department's beginning
inventory consisted of 56,800 units,...
asked 34 minutes ago -
a
sealed glass cylinder contains 325 g of N2 gas at 1.02 atm at 20 c....
asked 38 minutes ago -
The main difference between an equity and a nonequity alliance
is that
A
equity alliances are...
asked 36 minutes ago -
Need help with this, in JAVA, using netbeans. A
complete response will receive a positive comment...
asked 45 minutes ago -
An imprest petty cash fund of $600 was established for minor
disbursements. At the end of...
asked 50 minutes ago -
Sharpe Cutter is a small company that produces specialty knives
for paper cutting machinery. The annual...
asked 54 minutes ago -
Calculating the Ka of a weak acid from
pH:
The pH of a 0.68M solution of...
asked 55 minutes ago -
1.What process is pushing back against gravity in the very
center (the core) of sun-like stars?...
asked 1 hour ago -
This question is from the textbook "Python for ArcGIS" by Laura
Tateosian:
Write a script "triangles.py"...
asked 1 hour ago