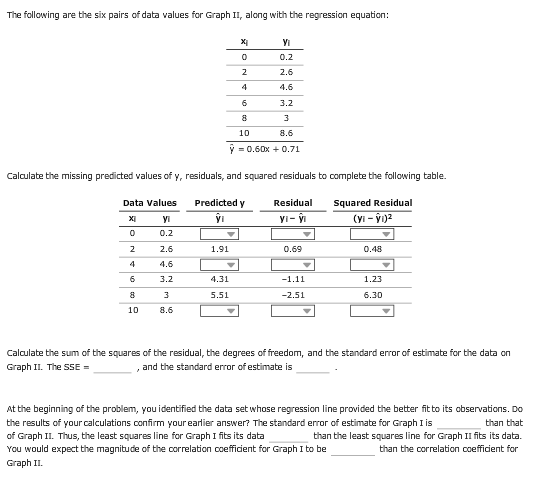
The following are the six pairs of data values for Graph II, along with the regression equation Yi 0.2 2.6 4.6 3.2 10 8.6 y = 0.60x +0.71 Calculabe the missing predicted values of y, residuals, and squared residuals to complete the following table. Data Values Predictedy Residual Squared Residual yi 0.2 2.6 4.6 3.2 yi 1.91 0.69 0.48 4.31 1.11 1.23 5.51 -2.51 6.30 10 8.6 Calculabe the sum of the squares of the residual, the degrees of freedom, and the standard error of estimate for the data on Graph II. The SSE- and the standard error of estimabe is , At the beginning of the problem, you identified the data set whose regression line provided the better fit to its observations. Do the results of your calculations confirm your earlier answer? The standard error of estimate for Graph 1 İS of Graph II. Thus, the least squares line for Graph I fits its data You would expect the magnitude of the correlation coefficient for Graph I to be Graph IL. than that ne for Graph II fits its data. than the correlation coefficient for than the least squares li
Homework Answers
Line in graph 1 fits the data better.
Degrees of freedom in both case is 4.
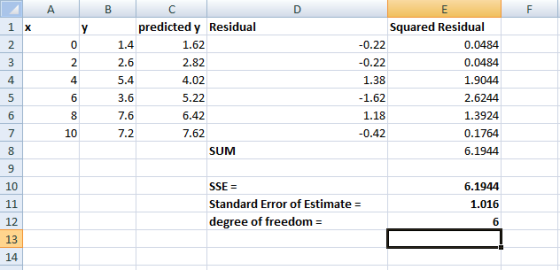
For Graph 1:
For Graph 2:
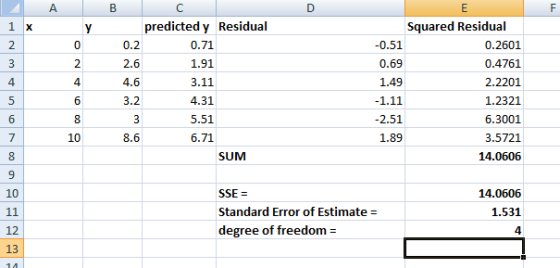
The standard error of estimate for graph 1 is smaller than that of graph 2. Thus the least squares line for graph 1 fits the data better than the least squares line for graph 2.
Correlation cofficient for graph 1 = 0.8968
Correlation cofficient for graph 2 = 0.7998
Correlation cofficient for graph 1 is greater than the Correlation cofficient for graph 2.
Yes results of calculations confirms our erlier answer that the line in graph 1 fits better than that of graph 2.
***************************************************
Add Answer to:
Attention: Due to 교 bug in Google Chrome, this page may not function correctly. Click her to lea...
4. Comparing the fit of the regression lines for two sets of data Aa Aa E...
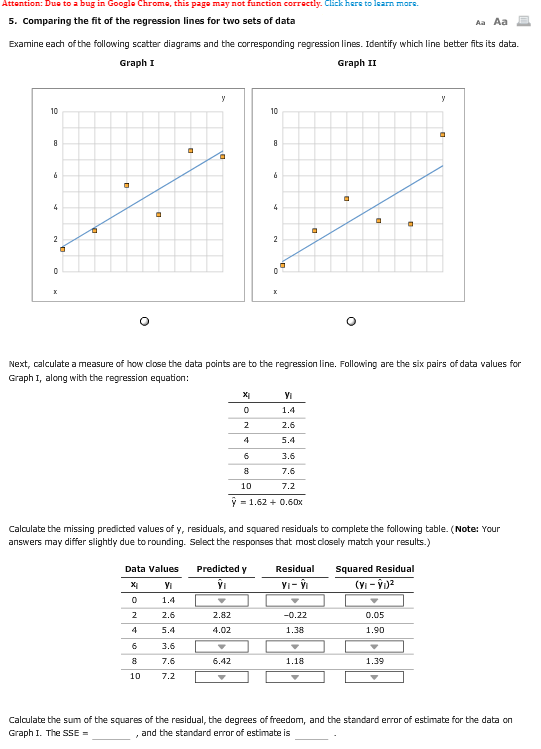
 4. Comparing the fit of the regression lines for two sets of data Aa Aa E Examine each of the following scatter diagrams and the corresponding regression lines. Identify which line better fits its data. Graph I Graph 11 Next, calculate a measure of how close the data points are to the regression line. Following are the six pairs of data values for Graph I, along with the regression equation: 5.6 6.6 9.6 y = -0.25 + 1.44x Assignment 14...
Attention: Due to a bug in Google Chrome, this page may not function correctly. Click here...
 Attention: Due to a bug in Google Chrome, this page may not function correctly. Click here to learn more. 5. Gravetter/Wallnau/Forzano, Essentials - Chapter 7 - End-of-chapter question 7 Aa Aa For a population with a mean of = 40 and a standard deviation of a = 8, find the z-score corresponding to each of the following samples. X = 34 for a sample of n - 1 score: Z -0.75 M - 34 for a sample of n =...
Attention: Due to a bug in Google Chrome, this page may not function correctly. Click here...
 Attention: Due to a bug in Google Chrome, this page may not function correctly. Click here to learn more. 1. Liquidity ratios Aa Aa Which of the following asset classes is generally considered to be the least liquid? O Cash O Inventories O Accounts receivable The most recent data from the annual balance sheets of a Company are as follows: Balance Sheet (Millions of dollars) Opera Company- Opera Industries Company Inc. Inc. Assets Current assets Current liabilities $184 Accounts payable...
Attention: Due to a bug in Google Chrome, this page may not function correctly. Click here...
 Attention: Due to a bug in Google Chrome, this page may not function correctly. Click here to learn more. Aa Aa 7. Gravetter/Wallnau/Forzano, Essentials - Chapter 7End-of-chapter question 21 A normal distribution has a mean of μ-60 and a standard deviation of σ = 12. For each of the following samples, compute the z-score for the sample mean, and determine whether the sample mean is a typical, representative value or an extreme value for a sample of this size. M...
Attention: Due to a bug in Google Chrome, this page may not function correctly. Click here...
 Attention: Due to a bug in Google Chrome, this page may not function correctly. Click here to learn more. Aa Aa 8. Determinants of intrinsic value Which of the following is a determinant of a firm's cost of capital? O Sales revenues O Cost of equity O Education of managers The following table presents some of the current year's financial data for the Green Zebra Media Company. Complete the table by computing Green Zebra's free cash flows and fundamental value...
ttention: Due to a bug in Google Chrome, this page may not function correctly. Click here...
 ttention: Due to a bug in Google Chrome, this page may not function correctly. Click here to learn more. 11. Chapter 12, Problem 11 Aa Aa E Binge drinking on college campuses has been a hot topic in the popular media and in scholarly research. In one study relating perfectionism to binge drinking, students were classified into three groups based on the number of binge drinking episodes they experienced during the past month (0, 1, 2 or more). The students...
corrections, please Attention: Due to a bug in Google Chrome, this page may not tunction correctly,...
 corrections, please
Attention: Due to a bug in Google Chrome, this page may not tunction correctly, Click here to learn more. Attention: Due to a bug in Google Chrome, this page may not function correcty Caick here to learn more. 4. Gravetter/Wallnau/Forzano, Essentials - Chapter 8- End-of-chapter question 6 Aa Aa Ackerman and Goldsmith (2011) report that students who study from a screen (phone, tablet, or computer) tended to have lower quiz scores than students who studied the same material...
corrections, please
Attention: Due to a bug in Google Chrome, this page may not tunction correctly, Click here to learn more. Attention: Due to a bug in Google Chrome, this page may not function correcty Caick here to learn more. 4. Gravetter/Wallnau/Forzano, Essentials - Chapter 8- End-of-chapter question 6 Aa Aa Ackerman and Goldsmith (2011) report that students who study from a screen (phone, tablet, or computer) tended to have lower quiz scores than students who studied the same material...
Attention:Due to a bug in Google Chrome, this page may not function correctly. Click hare to...
 Attention:Due to a bug in Google Chrome, this page may not function correctly. Click hare to lsarn mare 7. Using historical data to measure portfolio risk and correlation coefficient Aa Aa Michael is an investor who believes that past variability of stocks is a reasonably good estimate of future risk associated with the stocks. Michael works on creating a new portfolio and has already purchased stock A. Now he considers two other stocks, B and C. Michael collected data on...
Attention: Due to a bug in Google Chrome, this page may not function correctly. Click here to learn more. 18. Nonannual...
 Attention: Due to a bug in Google Chrome, this page may not function correctly. Click here to learn more. 18. Nonannual compounding period Aa Aa E The number of compounding periods in one year is called compounding frequency. The compounding frequency affects both the present and future values of cash flows. An investor can invest money with a particular bank and earn a stated interest rate of 6.60%; however, interest will be compounded quarterly. What are the nominal, periodic, and...
5. Consider the following data (You are allowed to use built-in function in R, but the...
 5. Consider the following data (You are allowed to use built-in function in R, but the code must be attached) X 99.0 101.1 102.7 103.0 105.4 107.0 108.7 110.8 112.1 112.4 113.6 113.8 115.1 115.4 120.0 y 28.8 27.9 27.0 25.2 22.8 21.5 20.9 19.6 17.1 18.9 16.0 16.7 13.0 13.6 10.8 (a) Obtain sample statistics such as sample mean of y and x and swa = n. 2-1(;- T)?, Say = n-1 =1(xi – 7)(yi – ). (b) Obtain...
 4. Comparing the fit of the regression lines for two sets of data Aa Aa E Examine each of the following scatter diagrams and the corresponding regression lines. Identify which line better fits its data. Graph I Graph 11 Next, calculate a measure of how close the data points are to the regression line. Following are the six pairs of data values for Graph I, along with the regression equation: 5.6 6.6 9.6 y = -0.25 + 1.44x Assignment 14...
 Attention: Due to a bug in Google Chrome, this page may not function correctly. Click here to learn more. 5. Gravetter/Wallnau/Forzano, Essentials - Chapter 7 - End-of-chapter question 7 Aa Aa For a population with a mean of = 40 and a standard deviation of a = 8, find the z-score corresponding to each of the following samples. X = 34 for a sample of n - 1 score: Z -0.75 M - 34 for a sample of n =...
 Attention: Due to a bug in Google Chrome, this page may not function correctly. Click here to learn more. 1. Liquidity ratios Aa Aa Which of the following asset classes is generally considered to be the least liquid? O Cash O Inventories O Accounts receivable The most recent data from the annual balance sheets of a Company are as follows: Balance Sheet (Millions of dollars) Opera Company- Opera Industries Company Inc. Inc. Assets Current assets Current liabilities $184 Accounts payable...
 Attention: Due to a bug in Google Chrome, this page may not function correctly. Click here to learn more. Aa Aa 7. Gravetter/Wallnau/Forzano, Essentials - Chapter 7End-of-chapter question 21 A normal distribution has a mean of μ-60 and a standard deviation of σ = 12. For each of the following samples, compute the z-score for the sample mean, and determine whether the sample mean is a typical, representative value or an extreme value for a sample of this size. M...
 Attention: Due to a bug in Google Chrome, this page may not function correctly. Click here to learn more. Aa Aa 8. Determinants of intrinsic value Which of the following is a determinant of a firm's cost of capital? O Sales revenues O Cost of equity O Education of managers The following table presents some of the current year's financial data for the Green Zebra Media Company. Complete the table by computing Green Zebra's free cash flows and fundamental value...
 ttention: Due to a bug in Google Chrome, this page may not function correctly. Click here to learn more. 11. Chapter 12, Problem 11 Aa Aa E Binge drinking on college campuses has been a hot topic in the popular media and in scholarly research. In one study relating perfectionism to binge drinking, students were classified into three groups based on the number of binge drinking episodes they experienced during the past month (0, 1, 2 or more). The students...
 corrections, please
Attention: Due to a bug in Google Chrome, this page may not tunction correctly, Click here to learn more. Attention: Due to a bug in Google Chrome, this page may not function correcty Caick here to learn more. 4. Gravetter/Wallnau/Forzano, Essentials - Chapter 8- End-of-chapter question 6 Aa Aa Ackerman and Goldsmith (2011) report that students who study from a screen (phone, tablet, or computer) tended to have lower quiz scores than students who studied the same material...
corrections, please
Attention: Due to a bug in Google Chrome, this page may not tunction correctly, Click here to learn more. Attention: Due to a bug in Google Chrome, this page may not function correcty Caick here to learn more. 4. Gravetter/Wallnau/Forzano, Essentials - Chapter 8- End-of-chapter question 6 Aa Aa Ackerman and Goldsmith (2011) report that students who study from a screen (phone, tablet, or computer) tended to have lower quiz scores than students who studied the same material...
 Attention:Due to a bug in Google Chrome, this page may not function correctly. Click hare to lsarn mare 7. Using historical data to measure portfolio risk and correlation coefficient Aa Aa Michael is an investor who believes that past variability of stocks is a reasonably good estimate of future risk associated with the stocks. Michael works on creating a new portfolio and has already purchased stock A. Now he considers two other stocks, B and C. Michael collected data on...
 Attention: Due to a bug in Google Chrome, this page may not function correctly. Click here to learn more. 18. Nonannual compounding period Aa Aa E The number of compounding periods in one year is called compounding frequency. The compounding frequency affects both the present and future values of cash flows. An investor can invest money with a particular bank and earn a stated interest rate of 6.60%; however, interest will be compounded quarterly. What are the nominal, periodic, and...
 5. Consider the following data (You are allowed to use built-in function in R, but the code must be attached) X 99.0 101.1 102.7 103.0 105.4 107.0 108.7 110.8 112.1 112.4 113.6 113.8 115.1 115.4 120.0 y 28.8 27.9 27.0 25.2 22.8 21.5 20.9 19.6 17.1 18.9 16.0 16.7 13.0 13.6 10.8 (a) Obtain sample statistics such as sample mean of y and x and swa = n. 2-1(;- T)?, Say = n-1 =1(xi – 7)(yi – ). (b) Obtain...
Most questions answered within 3 hours.
-
The average length of time between arrivals at a turnpike
toll-booth is 26 seconds. What is...
asked 1 hour ago -
(a) A piston at 6.1 atm contains a gas that occupies a volume of
3.5 L....
asked 2 hours ago -
Please answer true or false. Words
cannot be changed or added in to make it true...
asked 2 hours ago -
An empty test tube weighs 15.923 grams. Then,
MgCl2•6H2O is added into the test tube. After...
asked 2 hours ago -
Assume memory access is 10 units of time and disk access is
10000 units of time....
asked 3 hours ago -
1. Are all good samples random?
2. Magazines often report surveys giving statistics such as “63%...
asked 3 hours ago -
Under all the various types of market structures, firms
must eventually earn some economic profits for...
asked 3 hours ago -
Consider the following fitness regime for a single locus trait
with two co-dominant alleles: w11 =...
asked 3 hours ago -
A large cable company reports the following.
80% of its customers subscribe to its cable TV...
asked 3 hours ago -
Please answer the question in brief.
Discuss the role of ERP in organizations. Are ERP tools...
asked 3 hours ago -
Discuss the pros and cons of collaborative software such
as SameTime. Does it increase productivity? What...
asked 3 hours ago -
Buying your in-laws a gift because it’s expected is
due to the ____________ motive of gift-giving....
asked 3 hours ago