
Please solve the problems (d),(e),(f),(g)
(b) Find the vector of least squares estimates for the unknown regression parameters and the estimate of the corresponding covariance matrix (c) Fill in the values for the following ANOVA table: Source of Variation Sum of Squares df Mean Square F Regression on Xi, X2 Error Total (Corrected) (d) State the null and alternative hypotheses associated with the F test from the ANOVA table in part (c) and do the F test. (e) Compute R2. (f) Construct a 95% prediction interval for a new response Yo when Xi = 1.5 and X2 = are observed for explanatory variable. (g) Is the linear relationship between the mean response and the value of Xi significant when Xy is not included in the model? Test 11° : E(X)-An against Ha : E(X)-Љ+AXil. (h) Is the coefficient for X1 significant after X2 has been included in the model? (i) What can your conclude about the importance of Xi and X2 in describing the mean response!
Homework Answers
ANS:

Add Answer to:
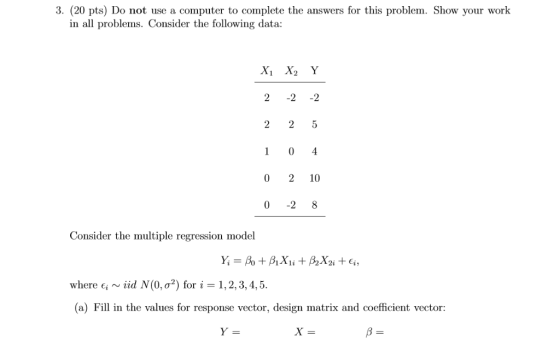
3. (20 pts) Do not use a computer to complete the answers for this problem. Show your work in all...
0 2 10 0 2 8 Consider the multiple regression model where є¡ ~ iid Ņ(0, σ*) for i = i, 2, 3, 4, 5...
 0 2 10 0 2 8 Consider the multiple regression model where є¡ ~ iid Ņ(0, σ*) for i = i, 2, 3, 4, 5. (c) Fill in the values for the following ANOVA table: Source of Variation Sum of Squares df Mean Square F Regression on Xi, X2 Error Total (Corrected) (d) State the nul and alternative hypotheses associated with the F test from the ANOVA table in part (c) and do the F test (e) Compute R2 (f)...
3. Consider the multiple linear regression model iid where Xi, . . . ,Xp-1 ,i are observed covariate values for observation i, and Ei ~N(0,ơ2) (a) What is the interpretation of B1 in this model? (b)...
 3. Consider the multiple linear regression model iid where Xi, . . . ,Xp-1 ,i are observed covariate values for observation i, and Ei ~N(0,ơ2) (a) What is the interpretation of B1 in this model? (b) Write the matrix form of the model. Label the response vector, design matrix, coefficient vector, and error vector, and specify the dimensions and elements for each. (c) Write the likelihood, log-likelihood, and in matrix form. aB (d) Solve : 0 for β, the MLE...
Q4.. [40 points] Consider the multiple linear regression model given by y - XB -+ s,...
 Q4.. [40 points] Consider the multiple linear regression model given by y - XB -+ s, where y and e are vectors of size 8 × 1, X ls a matrix of size 8 x 3 and Disa vector of sze 3 × 1. Also, the following information are available e = 22 y -2 and XTy 3 1. [10 points) Estimate the regression coefficients in the model given above? 2. [4 points] Estimate the variance of the error term...
(Do this problem without using R) Consider the simple linear regression model y =β0 + β1x...
(Do this problem without using R) Consider the simple linear regression model y =β0 + β1x + ε, where the errors are independent and normally distributed, with mean zero and constant variance σ2. Suppose we observe 4 observations x = (1, 1, −1, −1) and y = (5, 3, 4, 0). (a) Fit the simple linear regression model to this data and report the fitted regression line. (b) Carry out a test of hypotheses using α = 0.05 to determine...
Use the following linear regression equation to answer the questions. X1 = 1.7 + 3.6x2 -...
 Use the following linear regression equation to answer the questions. X1 = 1.7 + 3.6x2 - 8.4x3 + 1.5x4 (a) Which variable is the response variable? O X1 O X2 O X4 O X3 Which variables are the explanatory variables? (Select all that apply.) X3 X1 U X2 (b) Which number is the constant term? List the coefficients with their corresponding explanatory variables. constant X2 coefficient X3 coefficient X4 coefficient (c) If x2 = 8, X3 = 5, and x4...
The article The Influence of Temperature and Sunshine on the Alpha-Acid Contents of Hops t reports the following data o...
 The article The Influence of Temperature and Sunshine on the Alpha-Acid Contents of Hops t reports the following data on yield (y), mean temperature over the period between date of coming into hops and date of picking (x1), and mean percentage of sunshine during the same period (x2) for the Fuggle variety of hop 16.7 17.418.4 16.8 18.9 17.1 17.3 18.2 21.3 21.2 20.7 18.5 30 42 47 47 43 48 43 50 56 60 41 210 110 103 103...
If can't complete it all, I can post more questions just let me know!! There is an old saying in golf: "You drive for show and you putt for dough. "The point is that good putting is more...
 If can't complete it all, I can post more questions just let me
know!!
There is an old saying in golf: "You drive for show and you putt for dough. "The point is that good putting is more important than long driving for shooting low scores and hence winning money. To see if this is the case, data on the top 69 money winners on the PGA tour in 1993 are examined. The average number of putts per hole for...
If can't complete it all, I can post more questions just let me
know!!
There is an old saying in golf: "You drive for show and you putt for dough. "The point is that good putting is more important than long driving for shooting low scores and hence winning money. To see if this is the case, data on the top 69 money winners on the PGA tour in 1993 are examined. The average number of putts per hole for...
Find the sample variance of the dependent variable yi. What fraction of the sample variance in...
 Find the sample variance of the dependent variable
yi.
What fraction of the sample variance in
yi can be explained by the linear regression
model? Find the coefficient of determination,
r2.
Find the adjusted r2
value.
Do we have enough evidence to conclude that there exists
a strong linear relationship between xi and
yi? Find the p-value for the
test.
Problem. Chris Pratt is almost ready to pop the question to the girl of his dreams. He collected the data...
Find the sample variance of the dependent variable
yi.
What fraction of the sample variance in
yi can be explained by the linear regression
model? Find the coefficient of determination,
r2.
Find the adjusted r2
value.
Do we have enough evidence to conclude that there exists
a strong linear relationship between xi and
yi? Find the p-value for the
test.
Problem. Chris Pratt is almost ready to pop the question to the girl of his dreams. He collected the data...
Use the following linear regression equation to answer the questions. x1 = 1.7 + 3.9x2 -...
 Use the following linear regression equation to answer the questions. x1 = 1.7 + 3.9x2 - 8.1X3 + 1.9x4 (a) Which variable is the response variable? O O O O Which variables are the explanatory variables? (Select all that apply.) o X3 O X4 Сх, (b) Which number is the constant term? List the coefficients with their corresponding explanatory variables. constant X2 coefficient Xz coefficient x4 coefficient (C) If x2 = 8, X3 = 3, and X4 = 1, what...
The article "The Influence of Temperature and Sunshine on the Alpha-Acid Contents of Hops"t reports the followi...
 The article "The Influence of Temperature and Sunshine on the Alpha-Acid Contents of Hops"t reports the following data on yield (y), mean temperature over the period between date of coming into hops and date of picking (x1), and mean percentage of sunshine during the same period (x2) for the Fuggle variety of hop: X1 16.7 17.4 18.4 16.8 18.9 17.1 17.3 18.2 21.3 21.2 20.7 18.5 X2 48 30 42 47 47 43 41 44 43 50 56 60 76...
 0 2 10 0 2 8 Consider the multiple regression model where є¡ ~ iid Ņ(0, σ*) for i = i, 2, 3, 4, 5. (c) Fill in the values for the following ANOVA table: Source of Variation Sum of Squares df Mean Square F Regression on Xi, X2 Error Total (Corrected) (d) State the nul and alternative hypotheses associated with the F test from the ANOVA table in part (c) and do the F test (e) Compute R2 (f)...
 3. Consider the multiple linear regression model iid where Xi, . . . ,Xp-1 ,i are observed covariate values for observation i, and Ei ~N(0,ơ2) (a) What is the interpretation of B1 in this model? (b) Write the matrix form of the model. Label the response vector, design matrix, coefficient vector, and error vector, and specify the dimensions and elements for each. (c) Write the likelihood, log-likelihood, and in matrix form. aB (d) Solve : 0 for β, the MLE...
 Q4.. [40 points] Consider the multiple linear regression model given by y - XB -+ s, where y and e are vectors of size 8 × 1, X ls a matrix of size 8 x 3 and Disa vector of sze 3 × 1. Also, the following information are available e = 22 y -2 and XTy 3 1. [10 points) Estimate the regression coefficients in the model given above? 2. [4 points] Estimate the variance of the error term...
 Use the following linear regression equation to answer the questions. X1 = 1.7 + 3.6x2 - 8.4x3 + 1.5x4 (a) Which variable is the response variable? O X1 O X2 O X4 O X3 Which variables are the explanatory variables? (Select all that apply.) X3 X1 U X2 (b) Which number is the constant term? List the coefficients with their corresponding explanatory variables. constant X2 coefficient X3 coefficient X4 coefficient (c) If x2 = 8, X3 = 5, and x4...
 The article The Influence of Temperature and Sunshine on the Alpha-Acid Contents of Hops t reports the following data on yield (y), mean temperature over the period between date of coming into hops and date of picking (x1), and mean percentage of sunshine during the same period (x2) for the Fuggle variety of hop 16.7 17.418.4 16.8 18.9 17.1 17.3 18.2 21.3 21.2 20.7 18.5 30 42 47 47 43 48 43 50 56 60 41 210 110 103 103...
 If can't complete it all, I can post more questions just let me
know!!
There is an old saying in golf: "You drive for show and you putt for dough. "The point is that good putting is more important than long driving for shooting low scores and hence winning money. To see if this is the case, data on the top 69 money winners on the PGA tour in 1993 are examined. The average number of putts per hole for...
If can't complete it all, I can post more questions just let me
know!!
There is an old saying in golf: "You drive for show and you putt for dough. "The point is that good putting is more important than long driving for shooting low scores and hence winning money. To see if this is the case, data on the top 69 money winners on the PGA tour in 1993 are examined. The average number of putts per hole for...
 Find the sample variance of the dependent variable
yi.
What fraction of the sample variance in
yi can be explained by the linear regression
model? Find the coefficient of determination,
r2.
Find the adjusted r2
value.
Do we have enough evidence to conclude that there exists
a strong linear relationship between xi and
yi? Find the p-value for the
test.
Problem. Chris Pratt is almost ready to pop the question to the girl of his dreams. He collected the data...
Find the sample variance of the dependent variable
yi.
What fraction of the sample variance in
yi can be explained by the linear regression
model? Find the coefficient of determination,
r2.
Find the adjusted r2
value.
Do we have enough evidence to conclude that there exists
a strong linear relationship between xi and
yi? Find the p-value for the
test.
Problem. Chris Pratt is almost ready to pop the question to the girl of his dreams. He collected the data...
 Use the following linear regression equation to answer the questions. x1 = 1.7 + 3.9x2 - 8.1X3 + 1.9x4 (a) Which variable is the response variable? O O O O Which variables are the explanatory variables? (Select all that apply.) o X3 O X4 Сх, (b) Which number is the constant term? List the coefficients with their corresponding explanatory variables. constant X2 coefficient Xz coefficient x4 coefficient (C) If x2 = 8, X3 = 3, and X4 = 1, what...
 The article "The Influence of Temperature and Sunshine on the Alpha-Acid Contents of Hops"t reports the following data on yield (y), mean temperature over the period between date of coming into hops and date of picking (x1), and mean percentage of sunshine during the same period (x2) for the Fuggle variety of hop: X1 16.7 17.4 18.4 16.8 18.9 17.1 17.3 18.2 21.3 21.2 20.7 18.5 X2 48 30 42 47 47 43 41 44 43 50 56 60 76...
Most questions answered within 3 hours.
-
Calculate the approximate number of residues of Rubisco, which
is involved in carbon fixation in plants,...
asked 14 minutes ago -
Other decisions about scientific claims can have a much broader
impact.ENERGYarrow-10x10.png, environment, health, security - all...
asked 1 hour ago -
I need to write a research paper and work cited about this
topic: The United States...
asked 1 hour ago -
Hello! I was wondering if I could have some help?
If the vapor pressure of carvone...
asked 1 hour ago -
An economist wants to estimate the mean per capita income (in
thousands of dollars) for a...
asked 2 hours ago -
What would be the input/output characteristic of a circuit
obtained by putting two of your 2's-complementers...
asked 2 hours ago -
In Drosophila, the transition from the syncytial blastoderm
stage to the cellular blastoderm stage is a...
asked 2 hours ago -
Project management question:
Name 3 different types of resources (hint: humans are one
type)
asked 2 hours ago -
Consider the following reaction: C 2H 2( g) + 2H 2( g) C 2H 6(
g)...
asked 3 hours ago -
Consider a 1.0 L buffer containing 0.092 mol L-1 HCOOH and 0.100
mol L-1 HCOO-. What...
asked 3 hours ago -
Koch Realty has owned a vacant land with a FMV of
$775,000 and an adjusted basis...
asked 3 hours ago -
It is estimated 29% of all adults in United States invest in
stocks and that 85%...
asked 3 hours ago