|
 |
||||||||||||||||||||||||||||||||||||||||||||


 20.2%
20.2% 10.4%
10.4% 18.5%
18.5% 7.8%
7.8% 3.3%
3.3% 15.4%
15.4% 30.0%
30.0% 23.3%
23.3% |
 |
|
||||||||||||||||||||||||


 8.8%
8.8% 11.7%
11.7%All Return on Assets are wrong.
Homework Answers
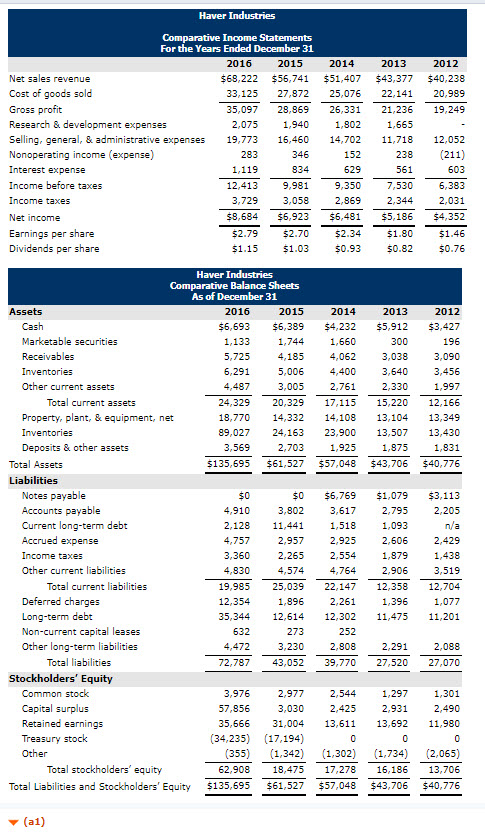
| 2016 | 2015 | 2014 | 2013 | |
| Total assets | 135695 | 61527 | 57048 | 43706 |
| Net income | 8684 | 6923 | 6481 | 5186 |
| Return on assets | 6.4 | 11.3 | 11.4 | 11.9 |
Add Answer to:
(a1) Your answer is correct. In his letters to shareholders in 2012, Haver’s CEO st...
Case Question 12-23 Haver Industries is a leading consumer products company. The company's adapted comparative balance...
 Case Question 12-23 Haver Industries is a leading consumer products company. The company's adapted comparative balance sheets and income statements (in $ millions) follow Haver Industries Comparative Income Statements For the Years Ended December 31 2016 2015 s68,222 s56.741 s51,407 ธ43.377 $40,238 Cost of goods sold Gross proft Research & development expenses Selling, general, & administrative expenses Nonoperabing income (expense) Iaterest expense 33,125 27.872 25,076 22,14 20,989 5.097 28,9 26.33 21,236 19,249 2,075 1,940 1802,665 19,773 16,460 14,702 11,718 12,052...
Case Question 12-23 Haver Industries is a leading consumer products company. The company's adapted comparative balance...
 Case Question 12-23 Haver Industries is a leading consumer products company. The company's adapted comparative balance sheets and income statements (in $ Haver Industries For the Years Ended December 31 Selling, general, administrative expenses 9,773 1440 4,702 11,718 12,052 Haver Industries Comparative Balance Sheets As of December 31 Marketable secunibies Property, plant, & eqǐpmere, net Tocal Liabisties and Stockholders Equity 135,695 $61527 $57,048 $43,706 40 776 In his letters to shareholders in 2012, Haver's CEO stated that the company's goal...
Liabilities current liabilities: Total current liabilities long-term liabilities: Total liabilities Equity total liabilities and equity We...
 Liabilities
current liabilities:
Total current liabilities
long-term liabilities:
Total liabilities
Equity
total liabilities and equity
We were unable to transcribe this imageWe were unable to transcribe this imageWe were unable to transcribe this imageWe were unable to transcribe this imageWe were unable to transcribe this imageWe were unable to transcribe this imageWe were unable to transcribe this imageWe were unable to transcribe this image42 Prepare a statement of owner's equity (cash withdrawals during 2013 were $11,800) for year 2013 and...
Liabilities
current liabilities:
Total current liabilities
long-term liabilities:
Total liabilities
Equity
total liabilities and equity
We were unable to transcribe this imageWe were unable to transcribe this imageWe were unable to transcribe this imageWe were unable to transcribe this imageWe were unable to transcribe this imageWe were unable to transcribe this imageWe were unable to transcribe this imageWe were unable to transcribe this image42 Prepare a statement of owner's equity (cash withdrawals during 2013 were $11,800) for year 2013 and...
Comparative Balance Sheets Consider the following balance sheet data for Great Buy Co, Inc, an electronics...
 Comparative Balance Sheets Consider the following balance sheet data for Great Buy Co, Inc, an electronics and major appliance retailer, at February 26, 2013 and Februar 27, 2012 (amounts in thousands): Feb. 26, 2013 Feb. 27, 2012 $7,138 37,968 637,950 249,991 9,829 764,610 304,926 172,724 126,442 7,774 $439,142 Cash and Cash Equivalents Accounts Receivables Merchandise Inventories Other Current Assets 59,872 52,944 13,844 Total Current Assets Property and Equipment (net) Other Assets Total Assets 15,160 $952,494 $402,028 $186,005 Current Liabilities We...
Balance Sheet Feb. 26, 2011 Feb. 27, 2010 (S millions) Cash and cash equivalents Short-term inves...
 We were unable to transcribe this imageBalance Sheet Feb. 26, 2011 Feb. 27, 2010 (S millions) Cash and cash equivalents Short-term investments Receivables 1,103 1,826 90 2,020 2,348 5,897 1,103 10,473 Merchandise inventories Other current assets Total current assets Property and equipment Land and buildings Leasehold improvements Fixtures and equipment Property under capital lease Gross property and equipment Less accumulated depreciation Net property and equipment 5,486 1,144 10,566 766 2,318 4,701 120 7,905 4,082 3,823 2,454 133 203 328 435...
Business Course Gross Profit Percentage The following financial data is from Brenner Instruments' financial statements (thousands...
 Business Course Gross Profit Percentage The following financial data is from Brenner Instruments' financial statements (thousands of dollars, except earnings per share.) 2019 Sales revenue Cost of goods sold Net income Dividends Earnings per share $210,000 125,000 8,300 2,600 4.15 Support Business Course $18,300 Assets Cash Accounts receivable (net) Inventory Total current assets Plant assets (net) Other assets Total assets Liabilities and Stockholders' Equity Notes payable-banks Accounts payable Accrued liabilities 46,000 39,500 103,800 52,600 15,600 $172,000 $18,000 41,000 43,700 102,700...
The answers are NOT any of the following... Attempt 1) 8.8, 11.7, 12.9, 12.3 Attempt 2)...
 The answers are NOT any of the following...
Attempt 1) 8.8, 11.7, 12.9, 12.3
Attempt 2) 6.4, 11.3, 11.4, 11.9
Attempt 3) 6.7, 7.9, 9, 8.3
Please HELP!!!!!
Case Question 12-23 Haver Industries is a leading consumer products company. The company's adapted comparative balance sheets and income statements (in $ Haver Industries Comparative Income Statements For the Years Ended December 31 Seling, general, & administrative expenses 29,773 14,MA 34,M2 11,718 12,052 Haver Industries Comparative Balance Sheets As of December 31...
The answers are NOT any of the following...
Attempt 1) 8.8, 11.7, 12.9, 12.3
Attempt 2) 6.4, 11.3, 11.4, 11.9
Attempt 3) 6.7, 7.9, 9, 8.3
Please HELP!!!!!
Case Question 12-23 Haver Industries is a leading consumer products company. The company's adapted comparative balance sheets and income statements (in $ Haver Industries Comparative Income Statements For the Years Ended December 31 Seling, general, & administrative expenses 29,773 14,MA 34,M2 11,718 12,052 Haver Industries Comparative Balance Sheets As of December 31...
Presented below is the adjusted trial balance of Tamarisk, Inc. at December 31, 2017. Prepare a...
 Presented below is the adjusted trial balance of Tamarisk, Inc.
at December 31, 2017.
Prepare a classified balance sheet as of December 31, 2017.
We were unable to transcribe this imageTamarisk, Inc. Balance Sheet December 31, 2017 Assets Current Assets Cash $ Accounts Receivable Supplies Prepaid Insurance Total Current Assets $ Equipment Less Accumulated Depreciation-Equipment Trademarks Total Assets Liabilities and Stockholders' Equity Current Liabilities Accounts Payable Salaries and Wages Payable Unearned Service Revenue Total Current Liabilities Long-term Liabilities Bonds Payable...
Presented below is the adjusted trial balance of Tamarisk, Inc.
at December 31, 2017.
Prepare a classified balance sheet as of December 31, 2017.
We were unable to transcribe this imageTamarisk, Inc. Balance Sheet December 31, 2017 Assets Current Assets Cash $ Accounts Receivable Supplies Prepaid Insurance Total Current Assets $ Equipment Less Accumulated Depreciation-Equipment Trademarks Total Assets Liabilities and Stockholders' Equity Current Liabilities Accounts Payable Salaries and Wages Payable Unearned Service Revenue Total Current Liabilities Long-term Liabilities Bonds Payable...
please show correct numbers We were unable to transcribe this imageW Answer is not complete. WEISMULLER...
 please show correct numbers
We were unable to transcribe this imageW Answer is not complete. WEISMULLER PUBLISHING COMPANY Balance Sheet At December 31, 2021 Assets Current assets: Cash and cash equivalents Investment in equity securities Accounts receivable 164,000 Allowance for uncollectible accounts (18,000) Net accounts receivable Inventory Prepaid expenses 101,000 144,000 146,000 287,000 90,000 768,000 $ Total current assets Property, plant, and equipment: Equipment Accumulated depreciation Net property, plant, and equipment Other assets: Prepaid expenses 324,000 (112,000) 212,000 62,000 $...
please show correct numbers
We were unable to transcribe this imageW Answer is not complete. WEISMULLER PUBLISHING COMPANY Balance Sheet At December 31, 2021 Assets Current assets: Cash and cash equivalents Investment in equity securities Accounts receivable 164,000 Allowance for uncollectible accounts (18,000) Net accounts receivable Inventory Prepaid expenses 101,000 144,000 146,000 287,000 90,000 768,000 $ Total current assets Property, plant, and equipment: Equipment Accumulated depreciation Net property, plant, and equipment Other assets: Prepaid expenses 324,000 (112,000) 212,000 62,000 $...
Case Question 12-23 Haver Industries is a leading consumer products company. The company's adapted comparative balance...
 Case Question 12-23 Haver Industries is a leading consumer products company. The company's adapted comparative balance sheets and income statements (in $ Haver Industries Comparative Income Statements For the Years Ended December 31 Seling, general, & administrative expenses 29,773 14,MA 34,M2 11,718 12,052 Haver Industries Comparative Balance Sheets As of December 31 Marketable secunibies Property, plant, & equipment, net Total Liabisties and Stockholders Equity 135,695 $61527 $57,048 $43,706 40 776 Your answer is correct. In his letters to shareholders in...
 Case Question 12-23 Haver Industries is a leading consumer products company. The company's adapted comparative balance sheets and income statements (in $ millions) follow Haver Industries Comparative Income Statements For the Years Ended December 31 2016 2015 s68,222 s56.741 s51,407 ธ43.377 $40,238 Cost of goods sold Gross proft Research & development expenses Selling, general, & administrative expenses Nonoperabing income (expense) Iaterest expense 33,125 27.872 25,076 22,14 20,989 5.097 28,9 26.33 21,236 19,249 2,075 1,940 1802,665 19,773 16,460 14,702 11,718 12,052...
 Case Question 12-23 Haver Industries is a leading consumer products company. The company's adapted comparative balance sheets and income statements (in $ Haver Industries For the Years Ended December 31 Selling, general, administrative expenses 9,773 1440 4,702 11,718 12,052 Haver Industries Comparative Balance Sheets As of December 31 Marketable secunibies Property, plant, & eqǐpmere, net Tocal Liabisties and Stockholders Equity 135,695 $61527 $57,048 $43,706 40 776 In his letters to shareholders in 2012, Haver's CEO stated that the company's goal...
 Liabilities
current liabilities:
Total current liabilities
long-term liabilities:
Total liabilities
Equity
total liabilities and equity
We were unable to transcribe this imageWe were unable to transcribe this imageWe were unable to transcribe this imageWe were unable to transcribe this imageWe were unable to transcribe this imageWe were unable to transcribe this imageWe were unable to transcribe this imageWe were unable to transcribe this image42 Prepare a statement of owner's equity (cash withdrawals during 2013 were $11,800) for year 2013 and...
Liabilities
current liabilities:
Total current liabilities
long-term liabilities:
Total liabilities
Equity
total liabilities and equity
We were unable to transcribe this imageWe were unable to transcribe this imageWe were unable to transcribe this imageWe were unable to transcribe this imageWe were unable to transcribe this imageWe were unable to transcribe this imageWe were unable to transcribe this imageWe were unable to transcribe this image42 Prepare a statement of owner's equity (cash withdrawals during 2013 were $11,800) for year 2013 and...
 Comparative Balance Sheets Consider the following balance sheet data for Great Buy Co, Inc, an electronics and major appliance retailer, at February 26, 2013 and Februar 27, 2012 (amounts in thousands): Feb. 26, 2013 Feb. 27, 2012 $7,138 37,968 637,950 249,991 9,829 764,610 304,926 172,724 126,442 7,774 $439,142 Cash and Cash Equivalents Accounts Receivables Merchandise Inventories Other Current Assets 59,872 52,944 13,844 Total Current Assets Property and Equipment (net) Other Assets Total Assets 15,160 $952,494 $402,028 $186,005 Current Liabilities We...
 We were unable to transcribe this imageBalance Sheet Feb. 26, 2011 Feb. 27, 2010 (S millions) Cash and cash equivalents Short-term investments Receivables 1,103 1,826 90 2,020 2,348 5,897 1,103 10,473 Merchandise inventories Other current assets Total current assets Property and equipment Land and buildings Leasehold improvements Fixtures and equipment Property under capital lease Gross property and equipment Less accumulated depreciation Net property and equipment 5,486 1,144 10,566 766 2,318 4,701 120 7,905 4,082 3,823 2,454 133 203 328 435...
 Business Course Gross Profit Percentage The following financial data is from Brenner Instruments' financial statements (thousands of dollars, except earnings per share.) 2019 Sales revenue Cost of goods sold Net income Dividends Earnings per share $210,000 125,000 8,300 2,600 4.15 Support Business Course $18,300 Assets Cash Accounts receivable (net) Inventory Total current assets Plant assets (net) Other assets Total assets Liabilities and Stockholders' Equity Notes payable-banks Accounts payable Accrued liabilities 46,000 39,500 103,800 52,600 15,600 $172,000 $18,000 41,000 43,700 102,700...
 The answers are NOT any of the following...
Attempt 1) 8.8, 11.7, 12.9, 12.3
Attempt 2) 6.4, 11.3, 11.4, 11.9
Attempt 3) 6.7, 7.9, 9, 8.3
Please HELP!!!!!
Case Question 12-23 Haver Industries is a leading consumer products company. The company's adapted comparative balance sheets and income statements (in $ Haver Industries Comparative Income Statements For the Years Ended December 31 Seling, general, & administrative expenses 29,773 14,MA 34,M2 11,718 12,052 Haver Industries Comparative Balance Sheets As of December 31...
The answers are NOT any of the following...
Attempt 1) 8.8, 11.7, 12.9, 12.3
Attempt 2) 6.4, 11.3, 11.4, 11.9
Attempt 3) 6.7, 7.9, 9, 8.3
Please HELP!!!!!
Case Question 12-23 Haver Industries is a leading consumer products company. The company's adapted comparative balance sheets and income statements (in $ Haver Industries Comparative Income Statements For the Years Ended December 31 Seling, general, & administrative expenses 29,773 14,MA 34,M2 11,718 12,052 Haver Industries Comparative Balance Sheets As of December 31...
 Presented below is the adjusted trial balance of Tamarisk, Inc.
at December 31, 2017.
Prepare a classified balance sheet as of December 31, 2017.
We were unable to transcribe this imageTamarisk, Inc. Balance Sheet December 31, 2017 Assets Current Assets Cash $ Accounts Receivable Supplies Prepaid Insurance Total Current Assets $ Equipment Less Accumulated Depreciation-Equipment Trademarks Total Assets Liabilities and Stockholders' Equity Current Liabilities Accounts Payable Salaries and Wages Payable Unearned Service Revenue Total Current Liabilities Long-term Liabilities Bonds Payable...
Presented below is the adjusted trial balance of Tamarisk, Inc.
at December 31, 2017.
Prepare a classified balance sheet as of December 31, 2017.
We were unable to transcribe this imageTamarisk, Inc. Balance Sheet December 31, 2017 Assets Current Assets Cash $ Accounts Receivable Supplies Prepaid Insurance Total Current Assets $ Equipment Less Accumulated Depreciation-Equipment Trademarks Total Assets Liabilities and Stockholders' Equity Current Liabilities Accounts Payable Salaries and Wages Payable Unearned Service Revenue Total Current Liabilities Long-term Liabilities Bonds Payable...
 please show correct numbers
We were unable to transcribe this imageW Answer is not complete. WEISMULLER PUBLISHING COMPANY Balance Sheet At December 31, 2021 Assets Current assets: Cash and cash equivalents Investment in equity securities Accounts receivable 164,000 Allowance for uncollectible accounts (18,000) Net accounts receivable Inventory Prepaid expenses 101,000 144,000 146,000 287,000 90,000 768,000 $ Total current assets Property, plant, and equipment: Equipment Accumulated depreciation Net property, plant, and equipment Other assets: Prepaid expenses 324,000 (112,000) 212,000 62,000 $...
please show correct numbers
We were unable to transcribe this imageW Answer is not complete. WEISMULLER PUBLISHING COMPANY Balance Sheet At December 31, 2021 Assets Current assets: Cash and cash equivalents Investment in equity securities Accounts receivable 164,000 Allowance for uncollectible accounts (18,000) Net accounts receivable Inventory Prepaid expenses 101,000 144,000 146,000 287,000 90,000 768,000 $ Total current assets Property, plant, and equipment: Equipment Accumulated depreciation Net property, plant, and equipment Other assets: Prepaid expenses 324,000 (112,000) 212,000 62,000 $...
 Case Question 12-23 Haver Industries is a leading consumer products company. The company's adapted comparative balance sheets and income statements (in $ Haver Industries Comparative Income Statements For the Years Ended December 31 Seling, general, & administrative expenses 29,773 14,MA 34,M2 11,718 12,052 Haver Industries Comparative Balance Sheets As of December 31 Marketable secunibies Property, plant, & equipment, net Total Liabisties and Stockholders Equity 135,695 $61527 $57,048 $43,706 40 776 Your answer is correct. In his letters to shareholders in...
Most questions answered within 3 hours.
-
Why did so many investment banks have to start buying CDO’s and
other mortgaged backed securities...
asked 11 minutes ago -
The mean cost of domestic airfares in the United States rose to
an all-time high of...
asked 22 minutes ago -
1.Magazine Luiza is a Brazilian retail chain for consumer
electronics. The company currently has 100 stores...
asked 21 minutes ago -
What is the molarity of ZnCl2 that forms when 25.0 g of zinc
completely reacts with...
asked 23 minutes ago -
For independent X and Y, we have probability density function
for them where pdf of X...
asked 33 minutes ago -
The decomposition of SO2Cl2 is first order in SO2Cl2 and has a
rate constant of 1.42...
asked 29 minutes ago -
How do I convert from volume percent to mole percent in the
distillation lab? ethy acetate...
asked 36 minutes ago -
8. An air-plane has an effective wing surface area of 14.0 m²
that is generating the...
asked 37 minutes ago -
A railroad worker was a person who worked on setting and moving
railroad tracks. In securing...
asked 36 minutes ago -
using RECURSIVE Functions in Java, create a public static String
doubleLetters (String word)
For ex) that...
asked 43 minutes ago -
With a $16 Trillion national ebt, and projected annual budget
eficits in excess of $1 Trillion...
asked 57 minutes ago -
A machine shop owner wishes to assign each of three machinists
(labeled 1, 2, and 3)...
asked 1 hour ago