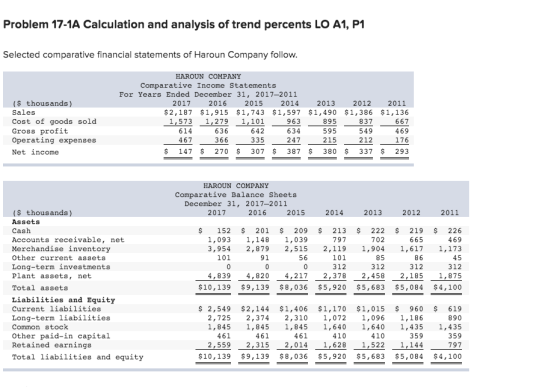

Comp IS Comp BS Complete the below table to calculate the trend percents for all components of comparative income stateme HAROUN COMPANY Income Statement Trends For Years Ended December 31, 2017-2011 2011 2017 2016 2015 2014 2013 2012 %) 100.01% 100.0 100.0 100.0 Sales Cost of goods sold Gross profit Operating expenses Net income %, 100.0
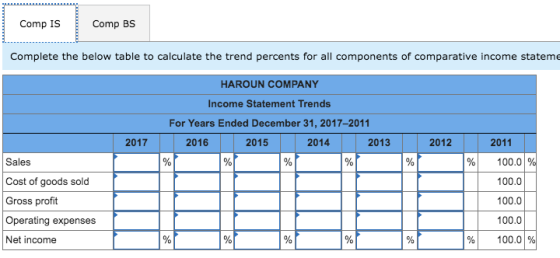
Comp IS Comp BS Complete the below table to calculate the trend percents for all components of comparative balance sheets us HAROUN COMPANY Balance Sheet Trends December 31, 2017-2011 2011 2017 2016 2015 2014 2013 2012 Assets Cash Accounts receivable, net Merchandise inventory Other current assets Long-term investments Plant assets, net Total assets %, 100.01% 100.0 100.0 100.0 100.0 100.0 100.0% %, Liabilities and Equity Current liabilities Long-term liabilities Common stock Other paid-in capital Retained earnings Total liabilities & equity %, 100.01% 100.0 100.0 100.0 100.0 100.0 %
Homework Answers
| HAROUN COMPANY | |||||||
| Income Statement Trends | |||||||
| For the year ended December 31, 2017-20177 | |||||||
| 2017 | 2016 | 2015 | 2014 | 2013 | 2012 | 2011 | |
| Sales | 192.5% | 168.6% | 153.4% | 140.6% | 131.2% | 122.0% | 100.0% |
| Cost of Goods Sold | 235.8% | 191.8% | 165.1% | 144.4% | 134.2% | 125.5% | 100.0% |
| Gross Profit | 130.9% | 135.6% | 136.9% | 135.2% | 126.9% | 117.1% | 100.0% |
| Operating Expenses | 265.3% | 208.0% | 190.3% | 140.3% | 122.2% | 120.5% | 100.0% |
| Net Income | 50.2% | 92.2% | 104.8% | 132.1% | 129.7% | 115.0% | 100.0% |
| HAROUN COMPANY | |||||||
| Comparative Balance Sheet Trends | |||||||
| December 31, 2017-20177 | |||||||
| 2017 | 2016 | 2015 | 2014 | 2013 | 2012 | 2011 | |
| Assets | |||||||
| Cash | 67.3% | 88.9% | 92.5% | 94.2% | 98.2% | 96.9% | 100.0% |
| Accounts Receivables,Net | 233.0% | 244.8% | 221.5% | 169.9% | 149.7% | 141.8% | 100.0% |
| Merchandise Inventory | 337.1% | 245.4% | 214.4% | 180.6% | 162.3% | 137.9% | 100.0% |
| Other Current Assets | 224.4% | 202.2% | 124.4% | 224.4% | 188.9% | 191.1% | 100.0% |
| Long term Investments | 0.0% | 0.0% | 0.0% | 100.0% | 100.0% | 100.0% | 100.0% |
| Plant assets, net | 258.1% | 257.1% | 224.9% | 126.8% | 131.1% | 116.5% | 100.0% |
| Total Assets | 247.3% | 222.9% | 196.0% | 144.4% | 138.6% | 124.0% | 100.0% |
| Liabilities amd Equity | |||||||
| Current Liabilities | 411.8% | 346.4% | 227.1% | 189.0% | 164.0% | 155.1% | 100.0% |
| Long-Term Liabilities | 306.2% | 266.7% | 259.6% | 120.4% | 123.1% | 133.3% | 100.0% |
| Common Stock | 128.6% | 128.6% | 128.6% | 114.3% | 114.3% | 100.0% | 100.0% |
| Other Paid-in Capital | 128.4% | 128.4% | 128.4% | 114.2% | 114.2% | 100.0% | 100.0% |
| Retained Earnings | 321.1% | 290.5% | 252.7% | 204.3% | 191.0% | 143.5% | 100.0% |
| Total Liabilities and equity | 247.3% | 222.9% | 196.0% | 144.4% | 138.6% | 124.0% | 100.0% |
Add Answer to:
( ( Problem 17-1A Calculation and analysis of trend percents LO A1, P1 Selected comparative finan...
i need it as soon as possiblemplease Selected comparative financial statements of Haroun Company follow. HAROUN...
 i need it as soon as possiblemplease
Selected comparative financial statements of Haroun Company follow. HAROUN COMPANY Comparative Income Statements For Years Ended December 31, 2017-2011 ($ thousands) 2017 2016 2015 2014 2013 2012 2011 Sales $2,516 $2,204 $2,295 $1,838 $1,715 $1,595 $1,307 Cost of goods sold 1,809 1,471 1,266 1,108 1,029 9 63 767 Gross profit 707 733 739730686632 540 Operating expenses 539 422 387 285 244 203 Net income $ 168 $ 311 $ 352 $ 445 $...
i need it as soon as possiblemplease
Selected comparative financial statements of Haroun Company follow. HAROUN COMPANY Comparative Income Statements For Years Ended December 31, 2017-2011 ($ thousands) 2017 2016 2015 2014 2013 2012 2011 Sales $2,516 $2,204 $2,295 $1,838 $1,715 $1,595 $1,307 Cost of goods sold 1,809 1,471 1,266 1,108 1,029 9 63 767 Gross profit 707 733 739730686632 540 Operating expenses 539 422 387 285 244 203 Net income $ 168 $ 311 $ 352 $ 445 $...
Problem 13-1A Calculation and analysis of trend percents LO A1, P1 Selected comparative financial statements of...
 Problem 13-1A Calculation and analysis of trend percents LO A1, P1 Selected comparative financial statements of Haroun Company follow. ($ thousands) Sales Cost of goods sold Gross profit Operating expenses Net income HAROUN COMPANY Comparative Income Statements For Years Ended December 31, 2017-2011 2017 2016 2015 2014 2013 $2,206 $1,932 $1,758 $1,611 $1,504 1,587 1,291 1,110 972 903 619 641 648 639 473 370 339 250 217 $ 146 $ 271 $ 309 $ 389 $ 384 2012 2011 $1,398...
Selected comparative financial statements of Haroun Company follow. ($ thousands) Sales Cost of goods sold Gross...
 Selected comparative financial statements of Haroun Company follow. ($ thousands) Sales Cost of goods sold Gross profit Operating expenses Net income HAROUN COMPANY Comparative Income Statements For Years Ended December 31, 2017-2011 2017 2016 2015 2014 2013 2012 2011 $2,716 $2,379 $2,164 $1,984 $1,851 $1,721 $1,411 1,952 366 1,196 1,111 1.039 798 419 FAROUN COMPANY Comparative Balance Sheets December 31, 2017-2011 2017 2016 2015 2014 2013 2012 2011 $ 152 § 201 $ 209 1.093 1,148 3,954 2.879 222 702...
please explain how to solve! Problem 13-1A Calculation and analysis of trend percents LO A1, P1...
 please explain how to solve!
Problem 13-1A Calculation and analysis of trend percents LO A1, P1 Selected comparative financial statements of Haroun Company follow. HAROUN COMPANY Comparative Income Statements For Years Ended December 31, 2017-2011 2017 2016 2015 2014 2013 $1,490 $1,305 $1,187 $1,088 $1,015 1,071 871 749 656 609 419 434 438 432 406 319 249 169 146 $ 100 $ 299 $ 263 $ 260 2012 $ 944 (5 thousands) Sales Cost of goods sold Gross profit Operating...
please explain how to solve!
Problem 13-1A Calculation and analysis of trend percents LO A1, P1 Selected comparative financial statements of Haroun Company follow. HAROUN COMPANY Comparative Income Statements For Years Ended December 31, 2017-2011 2017 2016 2015 2014 2013 $1,490 $1,305 $1,187 $1,088 $1,015 1,071 871 749 656 609 419 434 438 432 406 319 249 169 146 $ 100 $ 299 $ 263 $ 260 2012 $ 944 (5 thousands) Sales Cost of goods sold Gross profit Operating...
Selected comparative financial statements of Haroun Company follow. HAROUN COMPANY Comparative Income Statements For Years Ended...
 Selected comparative financial
statements of Haroun Company follow. HAROUN COMPANY Comparative
Income Statements For Years Ended December 31, 2017–2011 ($
thousands) 2017 2016 2015 2014 2013 2012 2011 Sales $ 2,089 $ 1,829
$ 1,664 $ 1,526 $ 1,424 $ 1,324 $ 1,085 Cost of goods sold 1,502
1,222 1,051 920 855 799 637 Gross profit 587 607 613 606 569 525
448 Operating expenses 446 349 320 236 205 202 168 Net income $ 141
$ 258 $ 293...
Selected comparative financial
statements of Haroun Company follow. HAROUN COMPANY Comparative
Income Statements For Years Ended December 31, 2017–2011 ($
thousands) 2017 2016 2015 2014 2013 2012 2011 Sales $ 2,089 $ 1,829
$ 1,664 $ 1,526 $ 1,424 $ 1,324 $ 1,085 Cost of goods sold 1,502
1,222 1,051 920 855 799 637 Gross profit 587 607 613 606 569 525
448 Operating expenses 446 349 320 236 205 202 168 Net income $ 141
$ 258 $ 293...
Selected comparative financial statements of Haroun Company follow. HAROUN COMPANY Comparative Income Statements For Years Ended...
 Selected comparative financial statements of Haroun Company follow. HAROUN COMPANY Comparative Income Statements For Years Ended December 31, 2017-2011 ($ thousands) Sales Cost of goods sold Gross profit Operating expenses 2017 2016 2015 2014 2013 2012 2011 $2,533 $2,219 $2,019 $1,850 $1,727 $1,606 $1,316 1,115 1,274 969 1,820 713 1,481 1,036 772 738 745 735 691 637 544 542 424 389 287 249 245 204 Net income 171 314 $ 356 $ 448 442 392 340 HAROUN COMPANY Comparative Balance...
Selected comparative financial statements of Haroun Company follow. ($ thousands) HARUN COMPANY Comparative Income Statements For...
 Selected comparative financial statements of Haroun Company follow. ($ thousands) HARUN COMPANY Comparative Income Statements For Years Ended December 31, 2017-2011 2017 2016 2015 2014 2013 2012 2011 $2,585 $2,264 $2,060 $1,888 91,762 $1,638 $1,343 1,858 1,5111,300 1,138 1.057 727 753 760 552 432 396 $ 175 $ 321 $ 164 $ 458 451 $ 399 $ 347 Cont of goods sold Cross profit Operating expenses Net Income 256 250 HARON COMPANY Comparative Balance sheets December 31, 2017-2011 2017 2016...
Selected comparative financial statements of Haroun Company follow. HAROUN COMPANY Comparative Income Statements For Years Ended...
 Selected comparative financial statements of Haroun Company follow. HAROUN COMPANY Comparative Income Statements For Years Ended December 31, 2017-2011 (s thousands) Sales 2813 2012 2011 2017 2016 2015 2014 $2,485 $2,177 $1,988 $1,815 $1,694 $1,575 $1,291 1,787 Cost of goods sold Gross profit Operating expenses 1,454 723 1,251 1,095 1,017 951 758 698 729 720 677 624 533 200 531 381 281 244 241 416 383 333 Net income 167 $ $ 307 348 S 439 $ 433 HAROUN COMPANY...
Selected comparative financial statements of Haroun Company follow. HAROUN COMPANY Comparative Income Statements For Years Ended...
 Selected comparative financial statements of Haroun Company follow. HAROUN COMPANY Comparative Income Statements For Years Ended December 31, 2017-2011 2016 $2,273 $1,991 1,329 ($thousands) 2017 2015 $1,812 1,143 2014 2013 2012 2011 $1,549 $1,441 $1,181 Sales $1,660 1,001 Cost of goods sold 1,634 930 870 693 Gross profit 639 662 669 659 619 571 488 Operating expenses 380 257 220 486 349 223 183 396 Net income 153 $ 282 $ 320 402 351 305 HAROUN COMPANY Comparative Balance Sheets...
Complete the below table to calculate the trend percents for all components of both statements using...
 Complete the below table to calculate the trend
percents for all
components of both statements using 2011 as the base year. (Round
your
percentage answers to 1 decimal place.)
can someone please help me
nalysis and Reporting Saved Toblem 17-1A Caiculation and analysis ot trena percents LO A1, P1 elected comparative financial statements of Haroun Company follow. HAROUN COMPANY Comparative Income Statements For Years Ended December 31, 2017-2011 2016 2015 (s thousands) Sales Cost of goods sold Gross profit Operating...
Complete the below table to calculate the trend
percents for all
components of both statements using 2011 as the base year. (Round
your
percentage answers to 1 decimal place.)
can someone please help me
nalysis and Reporting Saved Toblem 17-1A Caiculation and analysis ot trena percents LO A1, P1 elected comparative financial statements of Haroun Company follow. HAROUN COMPANY Comparative Income Statements For Years Ended December 31, 2017-2011 2016 2015 (s thousands) Sales Cost of goods sold Gross profit Operating...
 i need it as soon as possiblemplease
Selected comparative financial statements of Haroun Company follow. HAROUN COMPANY Comparative Income Statements For Years Ended December 31, 2017-2011 ($ thousands) 2017 2016 2015 2014 2013 2012 2011 Sales $2,516 $2,204 $2,295 $1,838 $1,715 $1,595 $1,307 Cost of goods sold 1,809 1,471 1,266 1,108 1,029 9 63 767 Gross profit 707 733 739730686632 540 Operating expenses 539 422 387 285 244 203 Net income $ 168 $ 311 $ 352 $ 445 $...
i need it as soon as possiblemplease
Selected comparative financial statements of Haroun Company follow. HAROUN COMPANY Comparative Income Statements For Years Ended December 31, 2017-2011 ($ thousands) 2017 2016 2015 2014 2013 2012 2011 Sales $2,516 $2,204 $2,295 $1,838 $1,715 $1,595 $1,307 Cost of goods sold 1,809 1,471 1,266 1,108 1,029 9 63 767 Gross profit 707 733 739730686632 540 Operating expenses 539 422 387 285 244 203 Net income $ 168 $ 311 $ 352 $ 445 $...
 Problem 13-1A Calculation and analysis of trend percents LO A1, P1 Selected comparative financial statements of Haroun Company follow. ($ thousands) Sales Cost of goods sold Gross profit Operating expenses Net income HAROUN COMPANY Comparative Income Statements For Years Ended December 31, 2017-2011 2017 2016 2015 2014 2013 $2,206 $1,932 $1,758 $1,611 $1,504 1,587 1,291 1,110 972 903 619 641 648 639 473 370 339 250 217 $ 146 $ 271 $ 309 $ 389 $ 384 2012 2011 $1,398...
 Selected comparative financial statements of Haroun Company follow. ($ thousands) Sales Cost of goods sold Gross profit Operating expenses Net income HAROUN COMPANY Comparative Income Statements For Years Ended December 31, 2017-2011 2017 2016 2015 2014 2013 2012 2011 $2,716 $2,379 $2,164 $1,984 $1,851 $1,721 $1,411 1,952 366 1,196 1,111 1.039 798 419 FAROUN COMPANY Comparative Balance Sheets December 31, 2017-2011 2017 2016 2015 2014 2013 2012 2011 $ 152 § 201 $ 209 1.093 1,148 3,954 2.879 222 702...
 please explain how to solve!
Problem 13-1A Calculation and analysis of trend percents LO A1, P1 Selected comparative financial statements of Haroun Company follow. HAROUN COMPANY Comparative Income Statements For Years Ended December 31, 2017-2011 2017 2016 2015 2014 2013 $1,490 $1,305 $1,187 $1,088 $1,015 1,071 871 749 656 609 419 434 438 432 406 319 249 169 146 $ 100 $ 299 $ 263 $ 260 2012 $ 944 (5 thousands) Sales Cost of goods sold Gross profit Operating...
please explain how to solve!
Problem 13-1A Calculation and analysis of trend percents LO A1, P1 Selected comparative financial statements of Haroun Company follow. HAROUN COMPANY Comparative Income Statements For Years Ended December 31, 2017-2011 2017 2016 2015 2014 2013 $1,490 $1,305 $1,187 $1,088 $1,015 1,071 871 749 656 609 419 434 438 432 406 319 249 169 146 $ 100 $ 299 $ 263 $ 260 2012 $ 944 (5 thousands) Sales Cost of goods sold Gross profit Operating...
 Selected comparative financial
statements of Haroun Company follow. HAROUN COMPANY Comparative
Income Statements For Years Ended December 31, 2017–2011 ($
thousands) 2017 2016 2015 2014 2013 2012 2011 Sales $ 2,089 $ 1,829
$ 1,664 $ 1,526 $ 1,424 $ 1,324 $ 1,085 Cost of goods sold 1,502
1,222 1,051 920 855 799 637 Gross profit 587 607 613 606 569 525
448 Operating expenses 446 349 320 236 205 202 168 Net income $ 141
$ 258 $ 293...
Selected comparative financial
statements of Haroun Company follow. HAROUN COMPANY Comparative
Income Statements For Years Ended December 31, 2017–2011 ($
thousands) 2017 2016 2015 2014 2013 2012 2011 Sales $ 2,089 $ 1,829
$ 1,664 $ 1,526 $ 1,424 $ 1,324 $ 1,085 Cost of goods sold 1,502
1,222 1,051 920 855 799 637 Gross profit 587 607 613 606 569 525
448 Operating expenses 446 349 320 236 205 202 168 Net income $ 141
$ 258 $ 293...
 Selected comparative financial statements of Haroun Company follow. HAROUN COMPANY Comparative Income Statements For Years Ended December 31, 2017-2011 ($ thousands) Sales Cost of goods sold Gross profit Operating expenses 2017 2016 2015 2014 2013 2012 2011 $2,533 $2,219 $2,019 $1,850 $1,727 $1,606 $1,316 1,115 1,274 969 1,820 713 1,481 1,036 772 738 745 735 691 637 544 542 424 389 287 249 245 204 Net income 171 314 $ 356 $ 448 442 392 340 HAROUN COMPANY Comparative Balance...
 Selected comparative financial statements of Haroun Company follow. ($ thousands) HARUN COMPANY Comparative Income Statements For Years Ended December 31, 2017-2011 2017 2016 2015 2014 2013 2012 2011 $2,585 $2,264 $2,060 $1,888 91,762 $1,638 $1,343 1,858 1,5111,300 1,138 1.057 727 753 760 552 432 396 $ 175 $ 321 $ 164 $ 458 451 $ 399 $ 347 Cont of goods sold Cross profit Operating expenses Net Income 256 250 HARON COMPANY Comparative Balance sheets December 31, 2017-2011 2017 2016...
 Selected comparative financial statements of Haroun Company follow. HAROUN COMPANY Comparative Income Statements For Years Ended December 31, 2017-2011 (s thousands) Sales 2813 2012 2011 2017 2016 2015 2014 $2,485 $2,177 $1,988 $1,815 $1,694 $1,575 $1,291 1,787 Cost of goods sold Gross profit Operating expenses 1,454 723 1,251 1,095 1,017 951 758 698 729 720 677 624 533 200 531 381 281 244 241 416 383 333 Net income 167 $ $ 307 348 S 439 $ 433 HAROUN COMPANY...
 Selected comparative financial statements of Haroun Company follow. HAROUN COMPANY Comparative Income Statements For Years Ended December 31, 2017-2011 2016 $2,273 $1,991 1,329 ($thousands) 2017 2015 $1,812 1,143 2014 2013 2012 2011 $1,549 $1,441 $1,181 Sales $1,660 1,001 Cost of goods sold 1,634 930 870 693 Gross profit 639 662 669 659 619 571 488 Operating expenses 380 257 220 486 349 223 183 396 Net income 153 $ 282 $ 320 402 351 305 HAROUN COMPANY Comparative Balance Sheets...
 Complete the below table to calculate the trend
percents for all
components of both statements using 2011 as the base year. (Round
your
percentage answers to 1 decimal place.)
can someone please help me
nalysis and Reporting Saved Toblem 17-1A Caiculation and analysis ot trena percents LO A1, P1 elected comparative financial statements of Haroun Company follow. HAROUN COMPANY Comparative Income Statements For Years Ended December 31, 2017-2011 2016 2015 (s thousands) Sales Cost of goods sold Gross profit Operating...
Complete the below table to calculate the trend
percents for all
components of both statements using 2011 as the base year. (Round
your
percentage answers to 1 decimal place.)
can someone please help me
nalysis and Reporting Saved Toblem 17-1A Caiculation and analysis ot trena percents LO A1, P1 elected comparative financial statements of Haroun Company follow. HAROUN COMPANY Comparative Income Statements For Years Ended December 31, 2017-2011 2016 2015 (s thousands) Sales Cost of goods sold Gross profit Operating...
Most questions answered within 3 hours.
-
(63
#14)
which of the following statments best describes how chamging
the concentration of the substances...
asked 2 hours ago -
In the following reaction, which element is undergoing
oxidation: Na2SO3 + N2O --> N2 + Na2SO4...
asked 3 hours ago -
Which of the following pairs of ions have the same electron
configuration?
I: Br− and Se2−...
asked 6 hours ago -
The Foremost Composite Materials Company is planning a two-day
sales conference for October 19-20. The conference...
asked 6 hours ago -
3) Illustrate the observed pattern of relatedness of organisms
versus adaptations to specific conditions. This means...
asked 7 hours ago -
In winter a lake has a 0.35 m thick ice layer over 1.10 m of
water....
asked 7 hours ago -
Assuming the following has been encrypted with a Vigenere cipher
below, use the method(s) and assumptions...
asked 8 hours ago -
How would I use switch statements to write a program that will
take an input of...
asked 8 hours ago -
Imagine a reaction in which methane gas combusts at a constant
pressure of 1 atm and...
asked 8 hours ago -
Two parallel wires (each 12 m in length) are separated by a
distance of 0.065 m...
asked 8 hours ago -
Suppose there were three masses at the corner of uniform
equilateral triangle. The masses are m1...
asked 8 hours ago -
Situation: A building that is 618 m above the ground floor. How
many times would a...
asked 8 hours ago