
Homework Answers


Add Answer to:
12.16 Calculating the pooled standard deviation. An experiment was run to compare three groups. T...
12.16 Calculating the pooled standard deviation. An experiment was run to compare three groups. The sample...
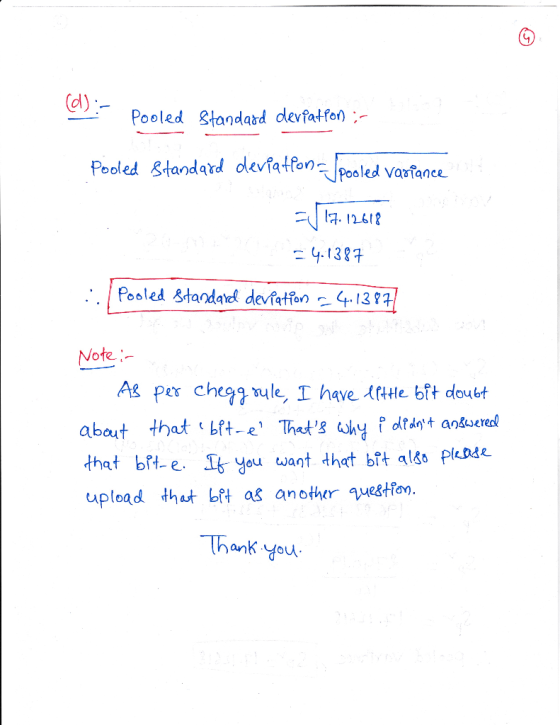
 12.16 Calculating the pooled standard deviation. An experiment was run to compare three groups. The sample sizes were 28, 33, and 102, and the corresponding estimated standard deviations were 2.7, 2.6, and 4.8. (a) Is it reasonable to use the assumption of equal standard deviations when we analyze these data? Give a reason for your answer. (b) Give the values of the variances for the three groups. (c) Find the pooled variance. (d) What is the value of the pooled...
An experiment was run to compare four groups. The standard deviations were 1.07, 1.51, 2.33, 2.67....
An experiment was run to compare four groups. The standard deviations were 1.07, 1.51, 2.33, 2.67. In this case, it is reasonable to assume all groups have equal variances. True False
For the independent-measures t test, which of the following describes the estimated standard error of M1 - M2 (whose sy...
 For the independent-measures t test, which of the following describes the estimated standard error of M1 - M2 (whose symbol is )? O The variance across all the data values when both samples are pooled together O A weighted average of the two sample variances (weighted by the sample sizes) O The difference between the standard deviations of the two samples O An estimate of the standard distance between the difference in sample means (M, - M2) and the difference...
For the independent measures ttast, which of the following describes the estimated standard error of the...
 For the independent measures ttast, which of the following describes the estimated standard error of the difference in sample means (whose symbolis )? The difference between the standard deviations of the two samples A weighted average of the two sample variances (weighted by the sample stres) An estimate of the standard distance between the difference in sample means (M. - Me) and the difference in the corresponding population means (Hi-Pa) The variance across all the data values when both samples...
In an experiment to compare bearing strengths of pegs inserted in two different types of mounts,...
 In an experiment to compare bearing strengths of pegs inserted in two different types of mounts, a sample of 14 observations on stress limit for red oak mounts resulted in a sample mean and sample standard deviation of 8.58 MPa and 0.77 MPa, respectively, whereas a sample of 12 observations when Douglas fir mounts were used gave a mean of 9.46 and a standard deviation of 1.52. Consider testing whether or not true average stress limits are identical for the...
An experiment was planned to compare the mean time (in days) required to recover from a...
 An experiment was planned to compare the mean time (in days) required to recover from a common cold for persons given a daily dose of 4 milligrams (mg) of vitamin C, 142, versus those who were not, H. Suppose that 32 adults were randomly selected for each treatment category and that the mean recovery times and standard deviations for the two groups were as follows. No Vitamin Supplement 32 Sample Size Sample Mean Sample Standard Deviation 4 mg Vitamin C...
Having the worst time trying to answer these three questions below. Assume that σ21=σ22=σ2. Calculate the...
Having the worst time trying to answer these three questions below. Assume that σ21=σ22=σ2. Calculate the pooled estimator of σ2 when the first sample gives s21=128 and the second independent sample gives s22= 128, and n1=n2=36. Give your answer to two decimal places , do not round up or down. And .. Two independent random samples have been slected ; 111 observations from population one and 143 observations from population two. From previous experience it is known that the standard...
A study was designed to compare the attitudes of two groups of nursing students towards computers. Group 1 had previousl...
A study was designed to compare the attitudes of two groups of nursing students towards computers. Group 1 had previously taken a statistical methods course that involved significant computer interaction. Group 2 had taken a statistic methods course that did not use computers. The students' attitudes were measured by administering the Computer Anxiety Rating Scale (CARS). A random sample of 16 nursing students from Group 1 resulted in a mean score of 41.3 with a standard deviation of 2.5. A...
QUESTION 3 a) Researchers want to test the effect of three different diets on the weight...
 QUESTION 3 a) Researchers want to test the effect of three different diets on the weight gain in 2 week- Diet 2 16 old lambs. The following table records the weight gain by the lambs. Diet 3 15 10 17 Diet 1 16 21 18 At the 0.05 level of significance, assess that there is a difference in the weight gain for each of the diet. (16 marks) b) Ten plots, each 10.4 meters, were randomly chosen in a large...
Given X, and x, distributions that are normal or approximately normal with unknown o, and on,...
 Given X, and x, distributions that are normal or approximately normal with unknown o, and on, the value of t corresponding to X, - X, has a distribution that is approximated by a Student's t distribution. We use the convention that the degrees of freedom is approximately the smaller of n - 1 and n, - 1. However, a more accurate estimate for the appropriate degrees of freedom is given by Satterthwaite's formula: 2 2 xn2 522 +$22) d.f. z...
 12.16 Calculating the pooled standard deviation. An experiment was run to compare three groups. The sample sizes were 28, 33, and 102, and the corresponding estimated standard deviations were 2.7, 2.6, and 4.8. (a) Is it reasonable to use the assumption of equal standard deviations when we analyze these data? Give a reason for your answer. (b) Give the values of the variances for the three groups. (c) Find the pooled variance. (d) What is the value of the pooled...
 For the independent-measures t test, which of the following describes the estimated standard error of M1 - M2 (whose symbol is )? O The variance across all the data values when both samples are pooled together O A weighted average of the two sample variances (weighted by the sample sizes) O The difference between the standard deviations of the two samples O An estimate of the standard distance between the difference in sample means (M, - M2) and the difference...
 For the independent measures ttast, which of the following describes the estimated standard error of the difference in sample means (whose symbolis )? The difference between the standard deviations of the two samples A weighted average of the two sample variances (weighted by the sample stres) An estimate of the standard distance between the difference in sample means (M. - Me) and the difference in the corresponding population means (Hi-Pa) The variance across all the data values when both samples...
 In an experiment to compare bearing strengths of pegs inserted in two different types of mounts, a sample of 14 observations on stress limit for red oak mounts resulted in a sample mean and sample standard deviation of 8.58 MPa and 0.77 MPa, respectively, whereas a sample of 12 observations when Douglas fir mounts were used gave a mean of 9.46 and a standard deviation of 1.52. Consider testing whether or not true average stress limits are identical for the...
 An experiment was planned to compare the mean time (in days) required to recover from a common cold for persons given a daily dose of 4 milligrams (mg) of vitamin C, 142, versus those who were not, H. Suppose that 32 adults were randomly selected for each treatment category and that the mean recovery times and standard deviations for the two groups were as follows. No Vitamin Supplement 32 Sample Size Sample Mean Sample Standard Deviation 4 mg Vitamin C...
 QUESTION 3 a) Researchers want to test the effect of three different diets on the weight gain in 2 week- Diet 2 16 old lambs. The following table records the weight gain by the lambs. Diet 3 15 10 17 Diet 1 16 21 18 At the 0.05 level of significance, assess that there is a difference in the weight gain for each of the diet. (16 marks) b) Ten plots, each 10.4 meters, were randomly chosen in a large...
 Given X, and x, distributions that are normal or approximately normal with unknown o, and on, the value of t corresponding to X, - X, has a distribution that is approximated by a Student's t distribution. We use the convention that the degrees of freedom is approximately the smaller of n - 1 and n, - 1. However, a more accurate estimate for the appropriate degrees of freedom is given by Satterthwaite's formula: 2 2 xn2 522 +$22) d.f. z...
Most questions answered within 3 hours.
-
IN PYTHON ONLY !! Program 2: Re-work
program #5 (WeeklyHours) from the previous assignment such that...
asked 5 minutes ago -
The average length of time between arrivals at a turnpike
toll-booth is 26 seconds. What is...
asked 1 hour ago -
(a) A piston at 6.1 atm contains a gas that occupies a volume of
3.5 L....
asked 2 hours ago -
Please answer true or false. Words
cannot be changed or added in to make it true...
asked 2 hours ago -
An empty test tube weighs 15.923 grams. Then,
MgCl2•6H2O is added into the test tube. After...
asked 2 hours ago -
Assume memory access is 10 units of time and disk access is
10000 units of time....
asked 3 hours ago -
1. Are all good samples random?
2. Magazines often report surveys giving statistics such as “63%...
asked 3 hours ago -
Under all the various types of market structures, firms
must eventually earn some economic profits for...
asked 3 hours ago -
Consider the following fitness regime for a single locus trait
with two co-dominant alleles: w11 =...
asked 3 hours ago -
A large cable company reports the following.
80% of its customers subscribe to its cable TV...
asked 3 hours ago -
Please answer the question in brief.
Discuss the role of ERP in organizations. Are ERP tools...
asked 3 hours ago -
Discuss the pros and cons of collaborative software such
as SameTime. Does it increase productivity? What...
asked 3 hours ago