A study was designed to compare the attitudes of two groups of nursing students towards computers. Group 1 had previousl...
A study was designed to compare the attitudes of two groups of nursing students towards computers. Group 1 had previously taken a statistical methods course that involved significant computer interaction. Group 2 had taken a statistic methods course that did not use computers. The students' attitudes were measured by administering the Computer Anxiety Rating Scale (CARS). A random sample of 16 nursing students from Group 1 resulted in a mean score of 41.3 with a standard deviation of 2.5. A random sample of 11 nursing students from Group 2 resulted in a mean score of 46.7 with a standard deviation of 4.8. Can you conclude that the mean score for Group 1 is significantly lower than the mean score for Group 2? Let μ1 represent the mean score for Group 1 and μ2 represent the mean score for Group 2. Use a significance level of α=0.01 for the test. Assume that the population variances are equal and that the two populations are normally distributed.
Step 1. State the null and alternative hypotheses for the test.
Step 2. Compute the value of the t test statistic. ( Round your answer to 3 decimals. )
Step 3. Determine the decision rule for rejecting the null hypothesis H0. Round your answer to three decimal places.
Step 4. State the test's conclusion. A) Reject Null Hypothesis B) Fail to Reject Null Hypothesis
Homework Answers
Let μ1 represent the mean score for Group 1 and μ2 represent the mean score for Group 2
Now , we want to test the claim that the mean score for Group 1 is significantly lower than the mean score for Group 2.
Step 1 ) Hypothesis :  Vs
Vs 
Since , the population variances are equal and that the two populations are normally distributed.
Therefore , use the t-test for two samples.
The pooled estimate is ,

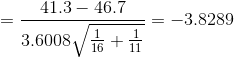
Step 2 ) The test statistic is ,

Step 3 ) Critical Value :  ; From t-table
Rejection rule : If  then reject Ho , accept otherwise
Decision : If 
Therefore , reject Ho
Step 4 )
Conclusion :
A) Reject Null Hypothesis
Hence , there is sufficient evidence to support the claim that the mean score for Group 1 is significantly lower than the mean score for Group 2.
Add Answer to:
A study was designed to compare the attitudes of two groups of nursing students towards computers. Group 1 had previousl...
A study was designed to compare the attitudes of two groups of nursing students towards computers....
 A study was designed to compare the attitudes of two groups of nursing students towards computers. Group 1 had previously taken a statistical methods course that involved significant computer interaction. Group 2 had taken a statistic methods course that did not use computers. The students' attitudes were measured by administering the Computer Anxiety Rating Scale (CARS). A random sample of 15 nursing students from Group 1 resulted in a mean score of 41.5 with a standard deviation of 4.2. A...
A study was designed to compare the attitudes of two groups of nursing students towards computers....
A study was designed to compare the attitudes of two groups of nursing students towards computers. Group 1 had previously taken a statistical methods course that involved significant computer interaction. Group 2 had taken a statistic methods course that did not use computers. The students' attitudes were measured by administering the Computer Anxiety Rating Scale (CARS). A random sample of 1111 nursing students from Group 1 resulted in a mean score of 40.840.8 with a standard deviation of 5.45.4. A...
A study was designed to compare the attitudes of two groups of nursing students towards computers....
A study was designed to compare the attitudes of two groups of nursing students towards computers. Group 1 had previously taken a statistical methods course that involved significant computer interaction. Group 2 had taken a statistic methods course that did not use computers. The students' attitudes were measured by administering the Computer Anxiety Rating Scale (CARS). A random sample of 16 nursing students from Group 1 resulted in a mean score of 55.4 with a standard deviation of 4.5 ....
A study was designed to compare the attitudes of two groups of nursing students towards computers....
A study was designed to compare the attitudes of two groups of nursing students towards computers. Group 1 had previously taken a statistical methods course that involved significant computer interaction. Group 2 had taken a statistic methods course that did not use computers. The students' attitudes were measured by administering the Computer Anxiety Rating Scale (CARS). A random sample of 18 nursing students from Group 1 resulted in a mean score of 44 with a standard deviation of 6.5. A...
A study was designed to compare the attitudes of two groups of nursing students towards computers....
A study was designed to compare the attitudes of two groups of nursing students towards computers. Group 1 had previously taken a statistical methods course that involved significant computer interaction. Group 2 had taken a statistic methods course that did not use computers. The students' attitudes were measured by administering the Computer Anxiety Rating Scale (CARS). A random sample of 11 nursing students from Group 1 resulted in a mean score of 49.8 with a standard deviation of 5.7. A...
A study was designed to compare the attitudes of two groups of nursing students towards computers....
A study was designed to compare the attitudes of two groups of nursing students towards computers. Group 1 had previously taken a statistical methods course that involved significant computer interaction. Group 2 had taken a statistic methods course that did not use computers. The students' attitudes were measured by administering the Computer Anxiety Rating Scale (CARS). A random sample of 15 nursing students from Group 1 resulted in a mean score of 66.5 with a standard deviation of 2.6. A...
A screening procedure was designed to measure attitudes towards minorities as managers. High scor...
A screening procedure was designed to measure attitudes towards minorities as managers. High scores indicate negative attitudes and low scores indicate positive attitudes. Independent random samples were taken of 151 male financial analysts and 108 female analysts. For the former group, the sample mean and standard deviation scores were 85.8 and 19.13, whereas the corresponding statistics for the latter group were 71.5 and 12.2. Test the null hypothesis that the two population means are equal against the alternative that the...
A group of n - 9 students was selected for a comparative study that involved their Exam 1 scores ...
 A group of n - 9 students was selected for a comparative study that involved their Exam 1 scores [variable - X] and their overall course grades [variable Y] Educators intend to draw inferences about the differences D = Y-X) assuming that differences are normally distributed with unknown parameters. The sample summaries are presented below. Summaries Values Average X X-bar]-74.98 | AverageYSample SD [D] [Y-barl-69.70 S = 9.0 Hypothesis Testing At the significance level, α-500, do you have enough evidence...
Please solve it with detailed explanation. Thank you! A test among three groups of students shows...
 Please solve it with detailed explanation.
Thank you!
A test among three groups of students shows significance with respect to differences in their GPAS. The mean of group 1 is 3.1, the mean of group 2 is 2.9, and the mean of group 3 is 3. The mean squared error is 0.7. There were 40, 25, and 35 students in each group, respectively. Test which group(s) is/are different from the others at the 0.05 significance level. The positive critical value...
Please solve it with detailed explanation.
Thank you!
A test among three groups of students shows significance with respect to differences in their GPAS. The mean of group 1 is 3.1, the mean of group 2 is 2.9, and the mean of group 3 is 3. The mean squared error is 0.7. There were 40, 25, and 35 students in each group, respectively. Test which group(s) is/are different from the others at the 0.05 significance level. The positive critical value...
A high school principle currently encourages students to enroll in a specific SAT prep program that...
 A high school principle currently encourages students to enroll in a specific SAT prep program that has a reputation of improving score by 50 points on average. A new SAT prep program has been released and claims to be better than their current program. The principle is thinking of advertising this new program to students if there is enough evidence at the 5% level that their claim is true. The principle tests the following hypotheses: Ho = 50 points HA...
 A study was designed to compare the attitudes of two groups of nursing students towards computers. Group 1 had previously taken a statistical methods course that involved significant computer interaction. Group 2 had taken a statistic methods course that did not use computers. The students' attitudes were measured by administering the Computer Anxiety Rating Scale (CARS). A random sample of 15 nursing students from Group 1 resulted in a mean score of 41.5 with a standard deviation of 4.2. A...
 A group of n - 9 students was selected for a comparative study that involved their Exam 1 scores [variable - X] and their overall course grades [variable Y] Educators intend to draw inferences about the differences D = Y-X) assuming that differences are normally distributed with unknown parameters. The sample summaries are presented below. Summaries Values Average X X-bar]-74.98 | AverageYSample SD [D] [Y-barl-69.70 S = 9.0 Hypothesis Testing At the significance level, α-500, do you have enough evidence...
 Please solve it with detailed explanation.
Thank you!
A test among three groups of students shows significance with respect to differences in their GPAS. The mean of group 1 is 3.1, the mean of group 2 is 2.9, and the mean of group 3 is 3. The mean squared error is 0.7. There were 40, 25, and 35 students in each group, respectively. Test which group(s) is/are different from the others at the 0.05 significance level. The positive critical value...
Please solve it with detailed explanation.
Thank you!
A test among three groups of students shows significance with respect to differences in their GPAS. The mean of group 1 is 3.1, the mean of group 2 is 2.9, and the mean of group 3 is 3. The mean squared error is 0.7. There were 40, 25, and 35 students in each group, respectively. Test which group(s) is/are different from the others at the 0.05 significance level. The positive critical value...
 A high school principle currently encourages students to enroll in a specific SAT prep program that has a reputation of improving score by 50 points on average. A new SAT prep program has been released and claims to be better than their current program. The principle is thinking of advertising this new program to students if there is enough evidence at the 5% level that their claim is true. The principle tests the following hypotheses: Ho = 50 points HA...
Most questions answered within 3 hours.
-
ECO
2013 &
asked 26 seconds from now -
Insight refers to:
a.
Adaptive decision-making
b.
Credibility and trustworthness
c.
Understanding of one's problems
d....
asked 5 minutes ago -
Explain the differences between rights and permissions within
Windows. Define the principle of least privilege and...
asked 13 minutes ago -
A solid, frictionless cylindrical reel of mass M=5.00kg and
radius R=0.55m is used to draw water...
asked 15 minutes ago -
how do radio waves get emitted from Jupiter?
- do they come from radiation from planet...
asked 16 minutes ago -
The test statistic used in the F test for the equality of two
variances is calculated...
asked 27 minutes ago -
How does neutralisation of IL-6 trans-signaling affect the
autoimmune disease and inflammation? What if the trans-signaling...
asked 17 minutes ago -
f an allele is 'fixed' in a population, what is its
frequency?
0.50
0.75
0.25
0...
asked 32 minutes ago -
Do we have a duty of national loyalty in business? What is the
major argument in...
asked 32 minutes ago -
compare the international treatment of segment reporting to the
us gaap treatment
asked 28 minutes ago -
A statistics student finds herself struggling with a newspaper
article stating that only eighteen percent of...
asked 1 hour ago -
People with beriberi, a disease caused by a thiamin deficiency,
have elevated levels of blood pyruvate...
asked 49 minutes ago