A study was designed to compare the attitudes of two groups of nursing students towards computers....
A study was designed to compare the attitudes of two groups of nursing students towards computers. Group 1 had previously taken a statistical methods course that involved significant computer interaction. Group 2 had taken a statistic methods course that did not use computers. The students' attitudes were measured by administering the Computer Anxiety Rating Scale (CARS). A random sample of 16 nursing students from Group 1 resulted in a mean score of 55.4 with a standard deviation of 4.5 . A random sample of 8 nursing students from Group 2 resulted in a mean score of 66 with a standard deviation of 8.3 . Can you conclude that the mean score for Group 1 is significantly lower than the mean score for Group 2? Let μ1 represent the mean score for Group 1 and μ2 represent the mean score for Group 2. Use a significance level of α=0.05 for the test. Assume that the population variances are equal and that the two populations are normally distributed.
Step 1 of 4:
State the null and alternative hypotheses for the test.
Step 2 of 4:
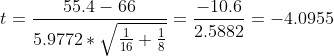
Compute the value of the t test statistic. Round your answer to three decimal places.
Step 3 of 4:
Determine the decision rule for rejecting the null hypothesis H0 . Round your answer to three decimal places.
Step 4 of 4:
State the test's conclusion.
Homework Answers
n 1= 16
n 2=8


s1 = 4.5
s2 = 8.3
claim: mean score for Group 1 is significantly lower than the mean score for Group 2
Step 1 of 4:
Null and alternative hypothesis is

Vs

Level of significance = 0.05
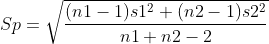
Step 2 of 4:
Here Population variances are equal.
So we have to use pooled variance.
Formula


Step 3 of 4:
Decision rule : p-value < α , Reject H0
d.f = n1 + n2 – 2 = 16 + 8 - 2 = 22

p-value = 0.0002 ( using t table )
p-value < α , Reject H0
Step 4 of 4:
conclusion : There is a sufficient evidence to support the claim that the mean score for Group 1 is significantly lower than the mean score for Group 2
Add Answer to:
A study was designed to compare the attitudes of two groups of
nursing students towards computers....
A study was designed to compare the attitudes of two groups of nursing students towards computers....
A study was designed to compare the attitudes of two groups of nursing students towards computers. Group 1 had previously taken a statistical methods course that involved significant computer interaction. Group 2 had taken a statistic methods course that did not use computers. The students' attitudes were measured by administering the Computer Anxiety Rating Scale (CARS). A random sample of 1111 nursing students from Group 1 resulted in a mean score of 40.840.8 with a standard deviation of 5.45.4. A...
A study was designed to compare the attitudes of two groups of nursing students towards computers....
A study was designed to compare the attitudes of two groups of nursing students towards computers. Group 1 had previously taken a statistical methods course that involved significant computer interaction. Group 2 had taken a statistic methods course that did not use computers. The students' attitudes were measured by administering the Computer Anxiety Rating Scale (CARS). A random sample of 18 nursing students from Group 1 resulted in a mean score of 44 with a standard deviation of 6.5. A...
A study was designed to compare the attitudes of two groups of nursing students towards computers....
 A study was designed to compare the attitudes of two groups of nursing students towards computers. Group 1 had previously taken a statistical methods course that involved significant computer interaction. Group 2 had taken a statistic methods course that did not use computers. The students' attitudes were measured by administering the Computer Anxiety Rating Scale (CARS). A random sample of 15 nursing students from Group 1 resulted in a mean score of 41.5 with a standard deviation of 4.2. A...
A study was designed to compare the attitudes of two groups of nursing students towards computers....
A study was designed to compare the attitudes of two groups of nursing students towards computers. Group 1 had previously taken a statistical methods course that involved significant computer interaction. Group 2 had taken a statistic methods course that did not use computers. The students' attitudes were measured by administering the Computer Anxiety Rating Scale (CARS). A random sample of 11 nursing students from Group 1 resulted in a mean score of 49.8 with a standard deviation of 5.7. A...
A study was designed to compare the attitudes of two groups of nursing students towards computers. Group 1 had previousl...
A study was designed to compare the attitudes of two groups of nursing students towards computers. Group 1 had previously taken a statistical methods course that involved significant computer interaction. Group 2 had taken a statistic methods course that did not use computers. The students' attitudes were measured by administering the Computer Anxiety Rating Scale (CARS). A random sample of 16 nursing students from Group 1 resulted in a mean score of 41.3 with a standard deviation of 2.5. A...
A study was designed to compare the attitudes of two groups of nursing students towards computers....
A study was designed to compare the attitudes of two groups of nursing students towards computers. Group 1 had previously taken a statistical methods course that involved significant computer interaction. Group 2 had taken a statistic methods course that did not use computers. The students' attitudes were measured by administering the Computer Anxiety Rating Scale (CARS). A random sample of 15 nursing students from Group 1 resulted in a mean score of 66.5 with a standard deviation of 2.6. A...
A screening procedure was designed to measure attitudes towards minorities as managers. High scor...
A screening procedure was designed to measure attitudes towards minorities as managers. High scores indicate negative attitudes and low scores indicate positive attitudes. Independent random samples were taken of 151 male financial analysts and 108 female analysts. For the former group, the sample mean and standard deviation scores were 85.8 and 19.13, whereas the corresponding statistics for the latter group were 71.5 and 12.2. Test the null hypothesis that the two population means are equal against the alternative that the...
Two researchers conducted a study in which two groups of students were asked to answer 42...
 Two researchers conducted a study in which two groups of students were asked to answer 42 trivia questions from a board game. The students in group 1 were asked to spend 5 minutes thinking about what it would mean to be a professor, while the students in group 2 were asked to think about soccer hooligans. These pretest thoughts are a form of priming. The 200 students in group 1 had a mean score of 26.2 with a standard deviation...
ULA Fiduce IW 9. The Survey of Study Habits and Attitudes (SSHA) is a psychological test...
 ULA Fiduce IW 9. The Survey of Study Habits and Attitudes (SSHA) is a psychological test that measures the motivation, attitude toward school, and study habits of students. Scores range from 0 to 200. A selective private college gives the SSHA to a simple random sample of both male and female first-year students to study the difference in mean attitudes towards school and study habits between men and women. The data for men and women: n 5 Men 20 121.3...
7. The Survey of Study Habitss and Attitudes (SSHA) is a psychological test that measures the...
 7. The Survey of Study Habitss and Attitudes (SSHA) is a psychological test that measures the motivation, attitude toward school, and study habits of students. Scores range from 0 to 200. The mean score for U.S. college students is about 115, and the standard deviation is about 30. A teacher who suspects that older students have better attitudes toward school gives the SSHA to 25 students who are at least 30 years of age. Their mean score is x =...
 A study was designed to compare the attitudes of two groups of nursing students towards computers. Group 1 had previously taken a statistical methods course that involved significant computer interaction. Group 2 had taken a statistic methods course that did not use computers. The students' attitudes were measured by administering the Computer Anxiety Rating Scale (CARS). A random sample of 15 nursing students from Group 1 resulted in a mean score of 41.5 with a standard deviation of 4.2. A...
 Two researchers conducted a study in which two groups of students were asked to answer 42 trivia questions from a board game. The students in group 1 were asked to spend 5 minutes thinking about what it would mean to be a professor, while the students in group 2 were asked to think about soccer hooligans. These pretest thoughts are a form of priming. The 200 students in group 1 had a mean score of 26.2 with a standard deviation...
 ULA Fiduce IW 9. The Survey of Study Habits and Attitudes (SSHA) is a psychological test that measures the motivation, attitude toward school, and study habits of students. Scores range from 0 to 200. A selective private college gives the SSHA to a simple random sample of both male and female first-year students to study the difference in mean attitudes towards school and study habits between men and women. The data for men and women: n 5 Men 20 121.3...
 7. The Survey of Study Habitss and Attitudes (SSHA) is a psychological test that measures the motivation, attitude toward school, and study habits of students. Scores range from 0 to 200. The mean score for U.S. college students is about 115, and the standard deviation is about 30. A teacher who suspects that older students have better attitudes toward school gives the SSHA to 25 students who are at least 30 years of age. Their mean score is x =...
Most questions answered within 3 hours.
-
Based on the range, which of the following sets of scores has
the greatest variability? 3,...
asked 1 minute ago -
The extent to which assets are financed by borrowed funds and
other liabilities is indicated by:...
asked 58 minutes ago -
Explain in detail
Germany is the fifth largest economy
explain what goods and services Germany specializes...
asked 1 hour ago -
The density of platinum is 21.45 g/mL. If a cube of platinum
with a mass of...
asked 1 hour ago -
Accounts Receivable
Sales
A/R Posting
Extended Sales Invoice
Packing Slip
Compare invoice to packing slip 2...
asked 1 hour ago -
Michaella, age 23, is a full-time law student and is claimed by
her parents as a...
asked 1 hour ago -
Why are polymers not typically casted into products?
asked 1 hour ago -
When rolling a die 129 times, what is the probability of rolling
a 6 no more...
asked 1 hour ago -
4. A call option currently sells for $7.75. It has a strike
price of $85 and...
asked 1 hour ago -
1.
You need to prepare 10.0 liters of an acid aqueous solution with a
pH of...
asked 1 hour ago -
Along an aggregate supply curve, if the level of output is less
than the natural level...
asked 1 hour ago -
By 2025, annual consumption in emerging markets will total $30
trillion and contribute more than ________...
asked 1 hour ago