A study was designed to compare the attitudes of two groups of nursing students towards computers....
A study was designed to compare the attitudes of two groups of nursing students towards computers. Group 1 had previously taken a statistical methods course that involved significant computer interaction. Group 2 had taken a statistic methods course that did not use computers. The students' attitudes were measured by administering the Computer Anxiety Rating Scale (CARS). A random sample of 1111 nursing students from Group 1 resulted in a mean score of 40.840.8 with a standard deviation of 5.45.4. A random sample of 1313 nursing students from Group 2 resulted in a mean score of 54.554.5 with a standard deviation of 2.32.3. Can you conclude that the mean score for Group 1 is significantly lower than the mean score for Group 2? Let μ1μ1 represent the mean score for Group 1 and μ2μ2 represent the mean score for Group 2. Use a significance level of α=0.01α=0.01 for the test. Assume that the population variances are equal and that the two populations are normally distributed.
Step 1 of 4:
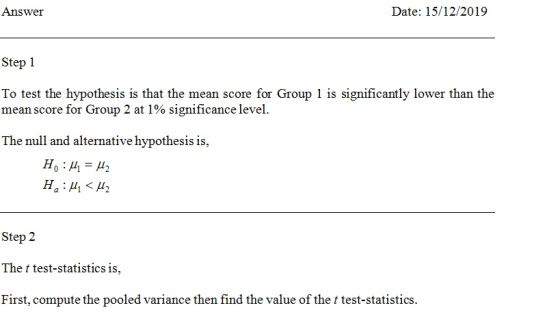
State the null and alternative hypotheses for the test.
Step 2 of 4:
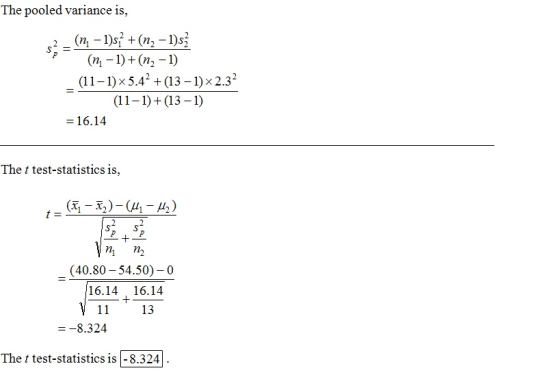
Compute the value of the t test statistic. Round your answer to three decimal places.
Step 3 of 4:
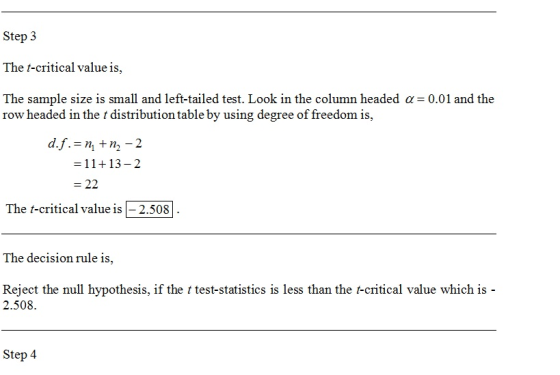
Determine the decision rule for rejecting the null hypothesis H0H0. Round your answer to three decimal places.
Step 4 of 4:
State the test's conclusion.
Homework Answers
Add Answer to:
A study was designed to compare the attitudes of two groups of
nursing students towards computers....
A study was designed to compare the attitudes of two groups of nursing students towards computers....
 A study was designed to compare the attitudes of two groups of nursing students towards computers. Group 1 had previously taken a statistical methods course that involved significant computer interaction. Group 2 had taken a statistic methods course that did not use computers. The students' attitudes were measured by administering the Computer Anxiety Rating Scale (CARS). A random sample of 15 nursing students from Group 1 resulted in a mean score of 41.5 with a standard deviation of 4.2. A...
A study was designed to compare the attitudes of two groups of nursing students towards computers....
A study was designed to compare the attitudes of two groups of nursing students towards computers. Group 1 had previously taken a statistical methods course that involved significant computer interaction. Group 2 had taken a statistic methods course that did not use computers. The students' attitudes were measured by administering the Computer Anxiety Rating Scale (CARS). A random sample of 16 nursing students from Group 1 resulted in a mean score of 55.4 with a standard deviation of 4.5 ....
A study was designed to compare the attitudes of two groups of nursing students towards computers....
A study was designed to compare the attitudes of two groups of nursing students towards computers. Group 1 had previously taken a statistical methods course that involved significant computer interaction. Group 2 had taken a statistic methods course that did not use computers. The students' attitudes were measured by administering the Computer Anxiety Rating Scale (CARS). A random sample of 18 nursing students from Group 1 resulted in a mean score of 44 with a standard deviation of 6.5. A...
A study was designed to compare the attitudes of two groups of nursing students towards computers....
A study was designed to compare the attitudes of two groups of nursing students towards computers. Group 1 had previously taken a statistical methods course that involved significant computer interaction. Group 2 had taken a statistic methods course that did not use computers. The students' attitudes were measured by administering the Computer Anxiety Rating Scale (CARS). A random sample of 11 nursing students from Group 1 resulted in a mean score of 49.8 with a standard deviation of 5.7. A...
A study was designed to compare the attitudes of two groups of nursing students towards computers. Group 1 had previousl...
A study was designed to compare the attitudes of two groups of nursing students towards computers. Group 1 had previously taken a statistical methods course that involved significant computer interaction. Group 2 had taken a statistic methods course that did not use computers. The students' attitudes were measured by administering the Computer Anxiety Rating Scale (CARS). A random sample of 16 nursing students from Group 1 resulted in a mean score of 41.3 with a standard deviation of 2.5. A...
A study was designed to compare the attitudes of two groups of nursing students towards computers....
A study was designed to compare the attitudes of two groups of nursing students towards computers. Group 1 had previously taken a statistical methods course that involved significant computer interaction. Group 2 had taken a statistic methods course that did not use computers. The students' attitudes were measured by administering the Computer Anxiety Rating Scale (CARS). A random sample of 15 nursing students from Group 1 resulted in a mean score of 66.5 with a standard deviation of 2.6. A...
A screening procedure was designed to measure attitudes towards minorities as managers. High scor...
A screening procedure was designed to measure attitudes towards minorities as managers. High scores indicate negative attitudes and low scores indicate positive attitudes. Independent random samples were taken of 151 male financial analysts and 108 female analysts. For the former group, the sample mean and standard deviation scores were 85.8 and 19.13, whereas the corresponding statistics for the latter group were 71.5 and 12.2. Test the null hypothesis that the two population means are equal against the alternative that the...
A systems analyst tests a new algorithm designed to work faster than the currently-used algorithm. Each...
A systems analyst tests a new algorithm designed to work faster than the currently-used algorithm. Each algorithm is applied to a group of 3333 sample problems. The new algorithm completes the sample problems with a mean time of 24.0524.05 hours. The current algorithm completes the sample problems with a mean time of 27.0127.01 hours. Assume the population standard deviation for the new algorithm is 5.3295.329 hours, while the current algorithm has a population standard deviation of 3.0783.078 hours. Conduct a...
An SAT prep course claims to improve the test score of students. The table below shows...
An SAT prep course claims to improve the test score of students. The table below shows the scores for seven students the first two times they took the verbal SAT. Before taking the SAT for the second time, each student took a course to try to improve his or her verbal SAT scores. Do these results support the claim that the SAT prep course improves the students' verbal SAT scores? Let d=(verbal SAT scores prior to taking the prep course)−(verbal...
 A study was designed to compare the attitudes of two groups of nursing students towards computers. Group 1 had previously taken a statistical methods course that involved significant computer interaction. Group 2 had taken a statistic methods course that did not use computers. The students' attitudes were measured by administering the Computer Anxiety Rating Scale (CARS). A random sample of 15 nursing students from Group 1 resulted in a mean score of 41.5 with a standard deviation of 4.2. A...
Most questions answered within 3 hours.
-
A hospital performs 100 surgeries per week. The probability that
complications after surgery occur is 10%....
asked 1 second ago -
A 5.20 mW helium neon laser emits a visible laser beam with a
wavelength of 633...
asked 34 seconds ago -
In preparing its cash flow statement for the year ended December
31, 2018, Green Co. gathered...
asked 1 minute ago -
Donna is 18 years old and full time accounting student.She is
saving for an overseas holiday...
asked 2 minutes ago -
Service-oriented architectures (SOA) provide
object-oriented architectures for web platforms that represent a
collection of services. SOA...
asked 2 minutes ago -
Le Terroir Winery is considering an expansion project to produce
fine wines. The trial expansion will...
asked 11 minutes ago -
The Bahraini public budget experiences deficit in the last
seven years, what are procedures are taken...
asked 18 minutes ago -
You invested $30,000 in a mutual fund at the beginning of the
year when the NAV...
asked 22 minutes ago -
Would you expect the price elasticity of supply for guitars to
be more inelastic in the...
asked 24 minutes ago -
A snowmobile is originally at the point with position vector
30.1 m at 95.0° counterclockwise from...
asked 24 minutes ago -
MAN3240 Organizational Behavior
In one to two paragraphs
6.) How can understanding emotions make me more...
asked 32 minutes ago -
Identify one individual who, in your opinion, is an excellent
leader. List the qualities that this...
asked 29 minutes ago