
Homework Answers
Degrees of freedom = n-k = 100 - 3 = 97
Where
n = 40+25+35 = 100
K = No. of groups = 3
Hence critical value = 1.985
It is obtained using R software, with command qt(0.975,97)
1. Group 1 vs group 2
Test statistic,

Fail to reject null hypothesis that  and conclude that
2. Group 1 vs group 3
Test statistic,

Fail to reject null hypothesis that  and conclude that
3. Group 2 vs group 3
Test statistic,
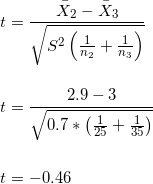
Positive test statistic, t =0.46
Fail to reject null hypothesis that  and conclude that
Add Answer to:
Please solve it with detailed explanation.
Thank you!
A test among three groups of students shows...
Test the claim that the mean GPA of night students is larger than 3 at the...
Test the claim that the mean GPA of night students is larger than 3 at the .025 significance level. Based on a sample of 15 people, the sample mean GPA was 3.05 with a standard deviation of 0.02, find the following to 4 decimal places: t-statistic and p-value Do we reject the null hypothesis, or fail to reject the null hypothesis?
A study was designed to compare the attitudes of two groups of nursing students towards computers. Group 1 had previousl...
A study was designed to compare the attitudes of two groups of nursing students towards computers. Group 1 had previously taken a statistical methods course that involved significant computer interaction. Group 2 had taken a statistic methods course that did not use computers. The students' attitudes were measured by administering the Computer Anxiety Rating Scale (CARS). A random sample of 16 nursing students from Group 1 resulted in a mean score of 41.3 with a standard deviation of 2.5. A...
Question: Hypothesis Testing test the following: Hypothesis Testing test the following: Determine if there is sufficient...
Question: Hypothesis Testing test the following: Hypothesis Testing test the following: Determine if there is sufficient evidence to conclude the average amount of births is over 8000 in the United States and territories at the 0.05 level of significance. Sample Size is 52 (states and US territories) Mean: 6,869 Median: 6,869 Standard Deviation: 8,100 Minimum: 569 Maximum : 45,805 Clearly state a null and alternative hypothesis. Give the value of the test statistic. Report the P-Value. Clearly state your conclusion...
Test the claim that the mean GPA of Orange Coast students is significantly different than the...
Test the claim that the mean GPA of Orange Coast students is significantly different than the mean GPA of Coastline students at the 0.05 significance level. The null and alternative hypothesis would be: The test is: two-tailed, right-tailed, left-tailed? The sample consisted of 60 Orange Coast students, with a sample mean GPA of 3.38 and a standard deviation of 0.04, and 60 Coastline students, with a sample mean GPA of 3.41 and a standard deviation of 0.06. The test statistic...
Test the claim that the mean GPA of night students is smaller than the mean GPA...
 Test the claim that the mean GPA of night students is smaller than the mean GPA of day students at the 0.05 significance level, The null and alternative hypothesis would he: HPxPD Ho: Un = yd H: PN PD HH:My CMD HUN MD Hai Py = PD HIPN Po H.Mn + My H.Py > Po H. x > Hp H.: 4n <H H.:Py + P The test is: right-tailed left-tailed two-tailed The sample consisted of 18 night students, with a...
Please help, I will leave a rating!! Test the claim that the mean GPA of night...
 Please help, I will leave a rating!!
Test the claim that the mean GPA of night students is significantly different than 3.3 at the 0.1 significance level. The null and alternative hypothesis would be: Но: и< 3.3 Но:р> 0.825 Но: р > 3.3 Но: p< 0.825 Но: — 3.3 Но:р Н: > 3.3 Н:р 0.825 0.825 H:и < 3.3 Н,:р> 0.825 H: и + 3.3 Н:р+ 0.825 The test is: two-tailed right-tailed left-tailed Based on a sample of 50 people,...
Please help, I will leave a rating!!
Test the claim that the mean GPA of night students is significantly different than 3.3 at the 0.1 significance level. The null and alternative hypothesis would be: Но: и< 3.3 Но:р> 0.825 Но: р > 3.3 Но: p< 0.825 Но: — 3.3 Но:р Н: > 3.3 Н:р 0.825 0.825 H:и < 3.3 Н,:р> 0.825 H: и + 3.3 Н:р+ 0.825 The test is: two-tailed right-tailed left-tailed Based on a sample of 50 people,...
A sample of 50 third-grade students had a average of 78 on a math proficiency test,...
A sample of 50 third-grade students had a average of 78 on a math proficiency test, with a sample standard deviation of 12. Is there enough evidence to conclude that the third-grade sample mean is different from the third-grade population mean of 67? Assume a 0.02 significance level. Use the Critical Value Method of Testing (this means NO P-Values!). In your work space below, you will need to have - 1. The null hypothesis, Ho 2. The alternative hypothesis, H1...
Test the claim that the mean GPA for student athletes is significantly different than 2.3 at...
 Test the claim that the mean GPA for student athletes is significantly different than 2.3 at the 0.1 significance level Based on a sample of 25 people, the sample mean GPA was 2.25 with a standard deviation of 0.03 The test statistic is (to 3 decimals) The p-value is: (to 3 decimals) Based on this we: Reject the null hypothesis Fail to reject the null hypothesis
Forty students are selected to take part in an experiment testing the effect of espresso consumption...
 Forty students are selected to take part in an experiment testing the effect of espresso consumption on math test scores. The students are split into four groups of ten: a control group is given no espresso, another group is given a single espresso, another is given a double espresso, and the last is given a triple espresso. After the espresso is administrated, the students take a math test. The sample means and standard deviations of the results are: . •...
Test the claim that the mean GPA of night students is significantly different than 2.3 at...
 Test the claim that the mean GPA of night students is significantly different than 2.3 at the 0.2 significance level. The null and alternative hypothesis would be: Ho:= 2.3 Ho:p = 0.575 Ho:f = 2.3 Ho:p = 0.575 H.:= 2.3 Ho:p=0.575 H:H+ 2.3 H :p < 0.575 H : > 2.3 H:p > 0.575 H:4 < 2.3 H :P + 0.575 The test is: two-tailed right-tailed left-tailed Based on a sample of 65 people, the sample mean GPA was 2.28...
 Test the claim that the mean GPA of night students is smaller than the mean GPA of day students at the 0.05 significance level, The null and alternative hypothesis would he: HPxPD Ho: Un = yd H: PN PD HH:My CMD HUN MD Hai Py = PD HIPN Po H.Mn + My H.Py > Po H. x > Hp H.: 4n <H H.:Py + P The test is: right-tailed left-tailed two-tailed The sample consisted of 18 night students, with a...
 Please help, I will leave a rating!!
Test the claim that the mean GPA of night students is significantly different than 3.3 at the 0.1 significance level. The null and alternative hypothesis would be: Но: и< 3.3 Но:р> 0.825 Но: р > 3.3 Но: p< 0.825 Но: — 3.3 Но:р Н: > 3.3 Н:р 0.825 0.825 H:и < 3.3 Н,:р> 0.825 H: и + 3.3 Н:р+ 0.825 The test is: two-tailed right-tailed left-tailed Based on a sample of 50 people,...
Please help, I will leave a rating!!
Test the claim that the mean GPA of night students is significantly different than 3.3 at the 0.1 significance level. The null and alternative hypothesis would be: Но: и< 3.3 Но:р> 0.825 Но: р > 3.3 Но: p< 0.825 Но: — 3.3 Но:р Н: > 3.3 Н:р 0.825 0.825 H:и < 3.3 Н,:р> 0.825 H: и + 3.3 Н:р+ 0.825 The test is: two-tailed right-tailed left-tailed Based on a sample of 50 people,...
 Test the claim that the mean GPA for student athletes is significantly different than 2.3 at the 0.1 significance level Based on a sample of 25 people, the sample mean GPA was 2.25 with a standard deviation of 0.03 The test statistic is (to 3 decimals) The p-value is: (to 3 decimals) Based on this we: Reject the null hypothesis Fail to reject the null hypothesis
 Forty students are selected to take part in an experiment testing the effect of espresso consumption on math test scores. The students are split into four groups of ten: a control group is given no espresso, another group is given a single espresso, another is given a double espresso, and the last is given a triple espresso. After the espresso is administrated, the students take a math test. The sample means and standard deviations of the results are: . •...
 Test the claim that the mean GPA of night students is significantly different than 2.3 at the 0.2 significance level. The null and alternative hypothesis would be: Ho:= 2.3 Ho:p = 0.575 Ho:f = 2.3 Ho:p = 0.575 H.:= 2.3 Ho:p=0.575 H:H+ 2.3 H :p < 0.575 H : > 2.3 H:p > 0.575 H:4 < 2.3 H :P + 0.575 The test is: two-tailed right-tailed left-tailed Based on a sample of 65 people, the sample mean GPA was 2.28...
Most questions answered within 3 hours.
-
The Problem: The Case of the Harmonizing Vacations
Your CEO is exploring partnering with a European...
asked 31 seconds ago -
A chemical equation is balanced by adding coefficients in front
of some formulas so that the...
asked 39 seconds from now -
From the literature (reference your sources): What are the
lattice parameters of calcite and aragonite? Why...
asked 39 minutes ago -
Your system is rejecting the question am asking which is
preceded by a case study. It...
asked 43 minutes ago -
3. On January 2, 2000, Larry creates a trust with himself as
trustee. Larry as trustee...
asked 40 minutes ago -
A member of the volleyball team spikes the ball. During this
process, she changes the velocity...
asked 47 minutes ago -
Are adult gamers less likely to use a gaming console (Xbox,
PlayStation, Wii, etc...) than teen...
asked 1 hour ago -
The University of
Texas recently reported that 43% of college students aged 18-24
would spend their...
asked 1 hour ago -
The length of stay at a specific emergency department in
Phoenix, Arizona, in 2009 had a...
asked 1 hour ago -
. Please give the mechanism for this type of problem. Step by
Step
The toxin that...
asked 1 hour ago -
If you have a 1M stock solution and you want to dilute 1 :10
with water,...
asked 1 hour ago -
In a load instruction, the effective address is obtained by
A) Retriving the address from a...
asked 1 hour ago