
Homework Answers
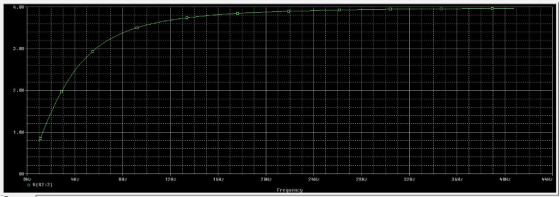
Its High pass filter and on analysis in PSpice, its observed
that, cut off frequency of the circuit is 5Hz

Both circuit simulated in PSpice and obtained same result with cut off frequency 5Hz.
Diagram of Op-Amp Active filter simulated in PSpice

Result of Simulation of above active filter

Diagram of Passive filter simulated in PSpice
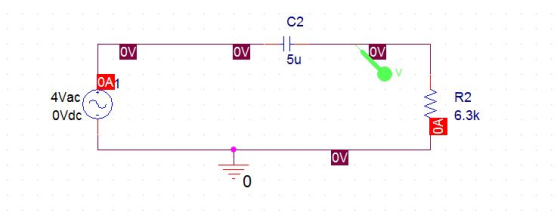
Result of Simulation of above passive filter
Add Answer to:
Cz 개2 Ci R1 Take RL = 20 kn, R1 = R2 10 An active network is representedas shown above. (a) Use ...
Please clear step by step and correct answers thumb up An RL circuit network is shown...
 Please clear step by step and correct answers thumb
up
An RL circuit network is shown below in Figure 2. + Vri(t) W R1 vs(t) R2 Figure 2 RL circuir network 1. If the system input is the voltage of power source (t) and the system output is VRI(!) (voltage across RI), write the transfer function T/s) (Do not plug in any detail value) (10 point) Use R1-19, R2-122, L=1H and assume zero initial condition for all following questions, 2....
Please clear step by step and correct answers thumb
up
An RL circuit network is shown below in Figure 2. + Vri(t) W R1 vs(t) R2 Figure 2 RL circuir network 1. If the system input is the voltage of power source (t) and the system output is VRI(!) (voltage across RI), write the transfer function T/s) (Do not plug in any detail value) (10 point) Use R1-19, R2-122, L=1H and assume zero initial condition for all following questions, 2....
Find the power of the signal conponent of a P is the Fourice t of s,(0)(2.5 points) edf,where S.f density of pu nose (2.5 points) . Consider the RL circuit shown below. Assume that R-10 and L-IN....
 Find the power of the signal conponent of a P is the Fourice t of s,(0)(2.5 points) edf,where S.f density of pu nose (2.5 points) . Consider the RL circuit shown below. Assume that R-10 and L-IN. Hint : Use Parseval's relationship if necessary i(t) e. What is the input signal-o-oise (SNR,ratio, defined as: SNR, 1olog..C)as polnts d. Find the output power spectral density of noise N,00 N,( HP, where HU) is the frequency response of the circuit, and N,(n)...
MENG 207-ELECTRICITY Department of Engineering & Design at Eastern Washington University Lab 6 PRE LAB 1. Print out lab handout and bring to lalb 2. Do calculations for part 1 in RC CIRCUIT s...
 MENG 207-ELECTRICITY Department of Engineering & Design at Eastern Washington University Lab 6 PRE LAB 1. Print out lab handout and bring to lalb 2. Do calculations for part 1 in RC CIRCUIT section. 3. Do calculations for part 1 in RL CIRCUIT section. 4. Do calculations for part 1 in RLC CIRCUIT section OBECTVE:response Use Multisim to study the transient response of an RC and RL circuit, and the frequency response of an RLC circuit. PROCEDURES 1. Record every...
 Please clear step by step and correct answers thumb
up
An RL circuit network is shown below in Figure 2. + Vri(t) W R1 vs(t) R2 Figure 2 RL circuir network 1. If the system input is the voltage of power source (t) and the system output is VRI(!) (voltage across RI), write the transfer function T/s) (Do not plug in any detail value) (10 point) Use R1-19, R2-122, L=1H and assume zero initial condition for all following questions, 2....
Please clear step by step and correct answers thumb
up
An RL circuit network is shown below in Figure 2. + Vri(t) W R1 vs(t) R2 Figure 2 RL circuir network 1. If the system input is the voltage of power source (t) and the system output is VRI(!) (voltage across RI), write the transfer function T/s) (Do not plug in any detail value) (10 point) Use R1-19, R2-122, L=1H and assume zero initial condition for all following questions, 2....
 Find the power of the signal conponent of a P is the Fourice t of s,(0)(2.5 points) edf,where S.f density of pu nose (2.5 points) . Consider the RL circuit shown below. Assume that R-10 and L-IN. Hint : Use Parseval's relationship if necessary i(t) e. What is the input signal-o-oise (SNR,ratio, defined as: SNR, 1olog..C)as polnts d. Find the output power spectral density of noise N,00 N,( HP, where HU) is the frequency response of the circuit, and N,(n)...
 MENG 207-ELECTRICITY Department of Engineering & Design at Eastern Washington University Lab 6 PRE LAB 1. Print out lab handout and bring to lalb 2. Do calculations for part 1 in RC CIRCUIT section. 3. Do calculations for part 1 in RL CIRCUIT section. 4. Do calculations for part 1 in RLC CIRCUIT section OBECTVE:response Use Multisim to study the transient response of an RC and RL circuit, and the frequency response of an RLC circuit. PROCEDURES 1. Record every...
Most questions answered within 3 hours.
-
If the Henry’s law constant for oxygen in water is 1.3 x 10⁻³
M/atm at 25...
asked 42 minutes ago -
A laser with a wavelength of 470. nm illuminates two narrow
slits. The interference pattern from...
asked 25 minutes ago -
1) In your own words, explain what elasticity of supply is
signifying. (Put in your own...
asked 16 minutes ago -
Who is ultimately responsible for formulating a firm's strategy
-- its managers, employees, or both? Explain.
asked 7 minutes ago -
Use De Broglie's wave equation to calculate the wavelength of an
electron moving at the speed...
asked 9 minutes ago -
The risk of material misstatement due to fraud relating to
revenue recognition should be a. given...
asked 21 minutes ago -
what is spanish flu epidemiology with photos and reference for
photos
asked 23 minutes ago -
Light of wavelength 500 nm is used in a two slit interference
experiment, and a fringe...
asked 42 minutes ago -
1. What is the concentration of potassium hydroxide in the
reaction mixture formed by mixing 50.00...
asked 39 minutes ago -
CISC 1115 Assignment 6 Write a complete program, including
javadoc comments, to process voter statistics Input...
asked 33 minutes ago -
(25) A boat is traveling at 5.00 m/s in the same direction as
ocean waves of...
asked 36 minutes ago -
which of these answers is most reasonable estimate of the proton
concentration [h+] for an aqueous...
asked 41 minutes ago