![o y=x10 on [0, 2] ys(1 + x)22 on [1,3] Need Help? Hoad (a) Estimate the area under the graph of fx) -2 + 2x2 from x--1 to x -](http://img.homeworklib.com/images/137579fa-3e3b-48af-92e1-ee188e4d3677.png?x-oss-process=image/resize,w_560)


answer all parts please
ⓘ슐 https://www.webassign.net/ eb Student/Assignment Responses ast?dep-211; eb 2.0 scientific cal.c..Periodic TableWorks.p... PBDAT breakdown (don.. kupdf.net fer Most Visited Getting Started o-1 -0.5 0.5 1 1.52 0.5 1 O-10.5 (b) Repeat part (a) using left endpoints. L6 - Sketch the curve and the approximating rectangles for L3. 10 . 10
0.5 1 1.5 2 O-1 0.5 O-1 0.5 0.5 1 1.5 (c) Repeat part (a) using midpoints M3 = M6 = Sketch the curve and the approximating rectangles for M3. 10+ 10 Type here to search
4 O-1 -0.5 0.5 .5 2 O-1 -0.5 0.5 (d) From your sketches in parts (a)-(c), which appears to be the best estimate? O L6 Watch It Read It Submit Answer Save Progress Practice Another Version Submit Assignment Save Assignment Progress Home My Assignments Extension Requesť O Type here to search
Homework Answers


Add Answer to:
O y=x10 on [0, 2] ys(1 + x)22 on [1,3] Need Help? Hoad (a) Estimate the area under the graph of f...
(a) Estimate the area under the graph of f(x) = 4 + 4x2 from x =...
 (a) Estimate the area under the graph of f(x) = 4 + 4x2 from x = -1 to x = 2 using three rectangles and right endpoints. R3 = 32 Then improve your estimate by using six rectangles. RG :- 27.5 Sketch the curve and the approximating rectangles for R3. у 20 у 20 15 15 10 10 O-1 2 у у 20 20 15 15 10 10 5 -1 1 2 1 2 Sketch the curve and the approximating...
Can i please get some step by step solutions for these endpoints? (a) Estimate the area...
 Can i please get some step by step solutions for these
endpoints?
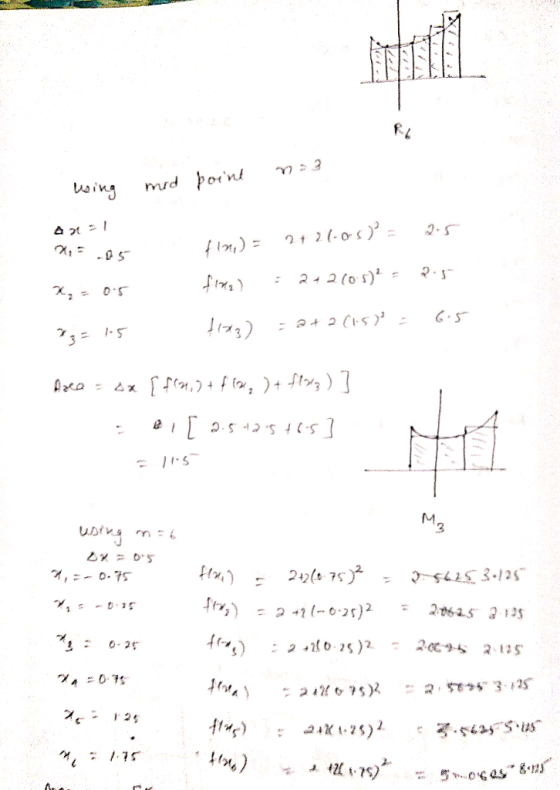
(a) Estimate the area under the graph of f(x) = 3 + 4x2 from x = -1 to x = 2 using three rectangles and right endpoints. R3 = 19 Then improve your estimate by using six rectangles. R6 - 6.875 X Sketch the curve and the approximating rectangles for R3. y у 15 15 10 10 -0.5 0.5 1.5 2 -0.5 0.5 1.5 x Es 2 (b)...
Can i please get some step by step solutions for these
endpoints?
(a) Estimate the area under the graph of f(x) = 3 + 4x2 from x = -1 to x = 2 using three rectangles and right endpoints. R3 = 19 Then improve your estimate by using six rectangles. R6 - 6.875 X Sketch the curve and the approximating rectangles for R3. y у 15 15 10 10 -0.5 0.5 1.5 2 -0.5 0.5 1.5 x Es 2 (b)...
(a) Estimate the area under the graph of f(x) = 2/x from x = 1 to...
 (a) Estimate the area under the graph of f(x) = 2/x from x = 1 to x = 5 using four approximating rectangles and right endpoints. | R = (b) Repeat part (a) using left endpoints. L = (c) By looking at a sketch of the graph and the rectangles, determine for each estimate whether is overestimates, underestimates, or is the exact area. ? 1. R4 42. L
PLEASE SHOW WORK WITH CLEAR STEPS 11. f (x) 5- x2 Estimate the area under the graph from x1 to x 2 using three rectangles and right endpoints. Then improve your estimate by using six rectangles. Sketc...
 PLEASE SHOW WORK WITH CLEAR
STEPS
11. f (x) 5- x2 Estimate the area under the graph from x1 to x 2 using three rectangles and right endpoints. Then improve your estimate by using six rectangles. Sketch the curve and the approximating rectangles. ее
11. f (x) 5- x2 Estimate the area under the graph from x1 to x 2 using three rectangles and right endpoints. Then improve your estimate by using six rectangles. Sketch the curve and the approximating...
PLEASE SHOW WORK WITH CLEAR
STEPS
11. f (x) 5- x2 Estimate the area under the graph from x1 to x 2 using three rectangles and right endpoints. Then improve your estimate by using six rectangles. Sketch the curve and the approximating rectangles. ее
11. f (x) 5- x2 Estimate the area under the graph from x1 to x 2 using three rectangles and right endpoints. Then improve your estimate by using six rectangles. Sketch the curve and the approximating...
(10 points) Use six rectangles to find an estimate of each type for the area under the given graph off from x...
 (10 points) Use six rectangles to find an estimate of each type for the area under the given graph off from x = 0 to x = 12. 1. Take the sample points from the left- endpoints Answer: L6 - 2. Is your estimate L6 an underestimate or overestimate of the true area? Choose one 3. Take the sample points from the right- endpoints. Answer: R6 1. Take the sample points from the left- endpoints. Answer: L - 2. Is...
Estimate the area under the graph of f(x) rectangles and right endpoints. 1 over the interval...
 Estimate the area under the graph of f(x) rectangles and right endpoints. 1 over the interval [ - 2, 3] using ten approximating +3 RE Repeat the approximation using left endpoints. Ln = Report answers accurate to 4 places. Remember not to round too early in your calculations.
Estimate the area under the graph of f(x)=x^2−2x+4x over the interval [0,8] using eight approximating rectangles...
Estimate the area under the graph of f(x)=x^2−2x+4x over the interval [0,8] using eight approximating rectangles and right endpoints. Rn= Repeat the approximation using left endpoints. Ln=
Consider the function x)-3x+2 Estimate the area between the graph of f and the x axis...
 Consider the function x)-3x+2 Estimate the area between the graph of f and the x axis between x-o and x-3 using six rectangles and right endpoints. Round your answer to two decimal places. Sketch the graph and the rectangles (b) Repeat part (a) using left endpoints. (Round your answer to two decimal places.) (b) Repeat part (a) using left endpoints. (Round your answer to two decimal places.) Sketch the graph and the rectangles -2 Need Help?
MY NOTES | ASKYC (1) Estimate the area under the graph of X) - 1/x from...
 MY NOTES | ASKYC (1) Estimate the area under the graph of X) - 1/x from x places.) 1 to x 2 using four approximating rectangles and right endpoints. (Round your answer to four d
Help please !!! answer all questions. thank u so much~! 1 Estimate the area under the...
 Help please !!! answer all questions. thank u so much~!
1 Estimate the area under the graph of f(x) rectangles and right endpoints. over the interval [0, 4] using five approximating x +4 Rn = Repeat the approximation using left endpoints. Ln= Report answers accurate to 4 places. Remember not to round too early in your calculations. Using Left Endpoint approximation, complete the following problems. Approximate the area under the curve f(x) = – 0.4x2 + 22 between x =...
Help please !!! answer all questions. thank u so much~!
1 Estimate the area under the graph of f(x) rectangles and right endpoints. over the interval [0, 4] using five approximating x +4 Rn = Repeat the approximation using left endpoints. Ln= Report answers accurate to 4 places. Remember not to round too early in your calculations. Using Left Endpoint approximation, complete the following problems. Approximate the area under the curve f(x) = – 0.4x2 + 22 between x =...
 (a) Estimate the area under the graph of f(x) = 4 + 4x2 from x = -1 to x = 2 using three rectangles and right endpoints. R3 = 32 Then improve your estimate by using six rectangles. RG :- 27.5 Sketch the curve and the approximating rectangles for R3. у 20 у 20 15 15 10 10 O-1 2 у у 20 20 15 15 10 10 5 -1 1 2 1 2 Sketch the curve and the approximating...
 Can i please get some step by step solutions for these
endpoints?
(a) Estimate the area under the graph of f(x) = 3 + 4x2 from x = -1 to x = 2 using three rectangles and right endpoints. R3 = 19 Then improve your estimate by using six rectangles. R6 - 6.875 X Sketch the curve and the approximating rectangles for R3. y у 15 15 10 10 -0.5 0.5 1.5 2 -0.5 0.5 1.5 x Es 2 (b)...
Can i please get some step by step solutions for these
endpoints?
(a) Estimate the area under the graph of f(x) = 3 + 4x2 from x = -1 to x = 2 using three rectangles and right endpoints. R3 = 19 Then improve your estimate by using six rectangles. R6 - 6.875 X Sketch the curve and the approximating rectangles for R3. y у 15 15 10 10 -0.5 0.5 1.5 2 -0.5 0.5 1.5 x Es 2 (b)...
 (a) Estimate the area under the graph of f(x) = 2/x from x = 1 to x = 5 using four approximating rectangles and right endpoints. | R = (b) Repeat part (a) using left endpoints. L = (c) By looking at a sketch of the graph and the rectangles, determine for each estimate whether is overestimates, underestimates, or is the exact area. ? 1. R4 42. L
 PLEASE SHOW WORK WITH CLEAR
STEPS
11. f (x) 5- x2 Estimate the area under the graph from x1 to x 2 using three rectangles and right endpoints. Then improve your estimate by using six rectangles. Sketch the curve and the approximating rectangles. ее
11. f (x) 5- x2 Estimate the area under the graph from x1 to x 2 using three rectangles and right endpoints. Then improve your estimate by using six rectangles. Sketch the curve and the approximating...
PLEASE SHOW WORK WITH CLEAR
STEPS
11. f (x) 5- x2 Estimate the area under the graph from x1 to x 2 using three rectangles and right endpoints. Then improve your estimate by using six rectangles. Sketch the curve and the approximating rectangles. ее
11. f (x) 5- x2 Estimate the area under the graph from x1 to x 2 using three rectangles and right endpoints. Then improve your estimate by using six rectangles. Sketch the curve and the approximating...
 (10 points) Use six rectangles to find an estimate of each type for the area under the given graph off from x = 0 to x = 12. 1. Take the sample points from the left- endpoints Answer: L6 - 2. Is your estimate L6 an underestimate or overestimate of the true area? Choose one 3. Take the sample points from the right- endpoints. Answer: R6 1. Take the sample points from the left- endpoints. Answer: L - 2. Is...
 Estimate the area under the graph of f(x) rectangles and right endpoints. 1 over the interval [ - 2, 3] using ten approximating +3 RE Repeat the approximation using left endpoints. Ln = Report answers accurate to 4 places. Remember not to round too early in your calculations.
 Consider the function x)-3x+2 Estimate the area between the graph of f and the x axis between x-o and x-3 using six rectangles and right endpoints. Round your answer to two decimal places. Sketch the graph and the rectangles (b) Repeat part (a) using left endpoints. (Round your answer to two decimal places.) (b) Repeat part (a) using left endpoints. (Round your answer to two decimal places.) Sketch the graph and the rectangles -2 Need Help?
 MY NOTES | ASKYC (1) Estimate the area under the graph of X) - 1/x from x places.) 1 to x 2 using four approximating rectangles and right endpoints. (Round your answer to four d
 Help please !!! answer all questions. thank u so much~!
1 Estimate the area under the graph of f(x) rectangles and right endpoints. over the interval [0, 4] using five approximating x +4 Rn = Repeat the approximation using left endpoints. Ln= Report answers accurate to 4 places. Remember not to round too early in your calculations. Using Left Endpoint approximation, complete the following problems. Approximate the area under the curve f(x) = – 0.4x2 + 22 between x =...
Help please !!! answer all questions. thank u so much~!
1 Estimate the area under the graph of f(x) rectangles and right endpoints. over the interval [0, 4] using five approximating x +4 Rn = Repeat the approximation using left endpoints. Ln= Report answers accurate to 4 places. Remember not to round too early in your calculations. Using Left Endpoint approximation, complete the following problems. Approximate the area under the curve f(x) = – 0.4x2 + 22 between x =...
Most questions answered within 3 hours.
-
Part 3: Arrows
Write a python program that prompts the user for a number of
columns,...
asked 2 minutes ago -
Need help answering these questions!!
1. What economic concept do you find most interesting in
Macroeconomics?...
asked 6 minutes ago -
1. Nimbus, Inc. produces and sells brooms. This table shows the
relationship between the number of...
asked 10 minutes ago -
A gas occupies 200. mL in a piston. If the pressure of the
piston were decreased...
asked 26 minutes ago -
A fossil is found to have a 14C level of 71.0% compared to
living organisms. How...
asked 30 minutes ago -
Many communist or socialist countries have a department that
addresses public health as well as the...
asked 32 minutes ago -
the following questions are either true or false answers
1. The Central Limit Theorem allows one...
asked 32 minutes ago -
The patient recovery time from a particular surgical procedure
is normally distributed with a mean of...
asked 38 minutes ago -
Human relations refer to the way a company arranges people,
jobs, and communications so that work...
asked 55 minutes ago -
Python Program: Design the logic for and implement a program
that merges the two files into...
asked 53 minutes ago -
The specific radiocarbon activity of a sample of wood is 6.25
gms dpm/gm of carbon. The...
asked 59 minutes ago -
An aqueous magnesium chloride solution is made by dissolving
6.96 moles of MgCl2 in sufficient water...
asked 1 hour ago