

Homework Answers
a) First we sketch the graph and the rectangles,
f(x) = 3x + 2
which is a linear equation with y-intercept 2
also at x = 3, f(x) = 3(3) + 2 = 11
which matches the third sketch shown
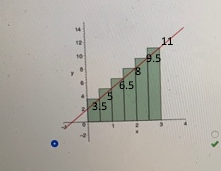
Therefore the total area is given as,
A = 0.5 x 3.5 + (0.5 x 5) + (0.5 x 6.5) + (0.5 x 8) + (0.5 x 9.5) + (0.5 x 11)
A = 21.75 sq. units
(b)
First we sketch the graph and the rectangles,
f(x) = 3x + 2
which is a linear equation with y-intercept 2
also at x = 2, f(x) = 3(2) + 2 = 8
which matches the first sketch shown

Therefore the total area is given as,
A = (0.5 x 2) + (0.5 x 3.5) + (0.5 x 5) + (0.5 x 6.5) + (0.5 x 8) + (0.5 x 9.5) =
A = 17.25 sq. units
Add Answer to:
Consider the function x)-3x+2 Estimate the area between the graph of f and the x axis...
(a) Estimate the area under the graph of f(x) = 2/x from x = 1 to...
 (a) Estimate the area under the graph of f(x) = 2/x from x = 1 to x = 5 using four approximating rectangles and right endpoints. | R = (b) Repeat part (a) using left endpoints. L = (c) By looking at a sketch of the graph and the rectangles, determine for each estimate whether is overestimates, underestimates, or is the exact area. ? 1. R4 42. L
Approximate the area under the graph of f(x) and above the X-axis with rectangles
f(x) = 3/x+4, from x = 1 to x = 9 Approximate the area under the graph of f(x) and above the X-axis with rectangles, using the following methods with n=4. (a) Use left endpoints. (b) Use right endpoints. (c) Average the answers in parts (a) and (b) (d) Use midpoints. The area, approximated using the left endpoints, is _______ (Round to two decimal places as needed.)
Estimate the area under the graph of f(x) rectangles and right endpoints. 1 over the interval...
 Estimate the area under the graph of f(x) rectangles and right endpoints. 1 over the interval [ - 2, 3] using ten approximating +3 RE Repeat the approximation using left endpoints. Ln = Report answers accurate to 4 places. Remember not to round too early in your calculations.
PLEASE SHOW WORK WITH CLEAR STEPS 11. f (x) 5- x2 Estimate the area under the graph from x1 to x 2 using three rectangles and right endpoints. Then improve your estimate by using six rectangles. Sketc...
 PLEASE SHOW WORK WITH CLEAR
STEPS
11. f (x) 5- x2 Estimate the area under the graph from x1 to x 2 using three rectangles and right endpoints. Then improve your estimate by using six rectangles. Sketch the curve and the approximating rectangles. ее
11. f (x) 5- x2 Estimate the area under the graph from x1 to x 2 using three rectangles and right endpoints. Then improve your estimate by using six rectangles. Sketch the curve and the approximating...
PLEASE SHOW WORK WITH CLEAR
STEPS
11. f (x) 5- x2 Estimate the area under the graph from x1 to x 2 using three rectangles and right endpoints. Then improve your estimate by using six rectangles. Sketch the curve and the approximating rectangles. ее
11. f (x) 5- x2 Estimate the area under the graph from x1 to x 2 using three rectangles and right endpoints. Then improve your estimate by using six rectangles. Sketch the curve and the approximating...
MY NOTES 5. - 6 POINTS SCALCLS15.1.004. (*) Estimate the area under the graph of 4...
 MY NOTES 5. - 6 POINTS SCALCLS15.1.004. (*) Estimate the area under the graph of 4 rectangles and right a r ound your answers to four decimal places) Sketch the graph and the rectangle 6 f(x) = 45 f(x) 4x Is your estimate an underestimate or an overestimate overestimate underestimate (b) Repeat part (a) using left endpoints. Sketch the graph and the rectangles. Sketch the graph and the rectangles. of f(x) = 45 6 f(x) = 45 6 f(x) =...
g(x) = 2x² + 2, [1, 3], 8 rectangles
Use left and right endpoints and the given number of rectangles to find two approximations of the area of the region between the graph of the function and the x-axis over the given interval. (Round your answers to four decimal places.) g(x) = 2x² + 2, [1, 3], 8 rectangles _______ < Area <_______ Use left and right endpoints and the given number of rectangles to find two approximations of the area of the region between the graph of the function and the...
XN +4, from x= 1 to x=9 Approximate the area under the graph of f(x) and...
 XN +4, from x= 1 to x=9 Approximate the area under the graph of f(x) and above the x-axis with rectangles, using the following methods with n = 4. (a) Use left endpoints. (b) Use right endpoints. (c) Average the answers in parts (a) and (b) (d) Use midpoints. . J. The area, approximated using the left endpoints, is (Round to two decimal places as needed.) The area, approximated using the right endpoints, is (Round to two decimal places as...
O y=x10 on [0, 2] ys(1 + x)22 on [1,3] Need Help? Hoad (a) Estimate the area under the graph of f...
 answer all parts please
o y=x10 on [0, 2] ys(1 + x)22 on [1,3] Need Help? Hoad (a) Estimate the area under the graph of fx) -2 + 2x2 from x--1 to x -2 using three rectangles and right endpoints Then improve your estimate by using six rectangles. Sketch the curve and the approximating rectangles for R3 아 10 4 O Type here to search ⓘ슐 https://www.webassign.net/ eb Student/Assignment Responses ast?dep-211; eb 2.0 scientific cal.c..Periodic TableWorks.p... PBDAT breakdown (don.. kupdf.net...
answer all parts please
o y=x10 on [0, 2] ys(1 + x)22 on [1,3] Need Help? Hoad (a) Estimate the area under the graph of fx) -2 + 2x2 from x--1 to x -2 using three rectangles and right endpoints Then improve your estimate by using six rectangles. Sketch the curve and the approximating rectangles for R3 아 10 4 O Type here to search ⓘ슐 https://www.webassign.net/ eb Student/Assignment Responses ast?dep-211; eb 2.0 scientific cal.c..Periodic TableWorks.p... PBDAT breakdown (don.. kupdf.net...
Estimate the area under the graph of f(x)=x^2−2x+4x over the interval [0,8] using eight approximating rectangles...
Estimate the area under the graph of f(x)=x^2−2x+4x over the interval [0,8] using eight approximating rectangles and right endpoints. Rn= Repeat the approximation using left endpoints. Ln=
(a) Estimate the area under the graph of f(x) = 4 + 4x2 from x =...
 (a) Estimate the area under the graph of f(x) = 4 + 4x2 from x = -1 to x = 2 using three rectangles and right endpoints. R3 = 32 Then improve your estimate by using six rectangles. RG :- 27.5 Sketch the curve and the approximating rectangles for R3. у 20 у 20 15 15 10 10 O-1 2 у у 20 20 15 15 10 10 5 -1 1 2 1 2 Sketch the curve and the approximating...
 (a) Estimate the area under the graph of f(x) = 2/x from x = 1 to x = 5 using four approximating rectangles and right endpoints. | R = (b) Repeat part (a) using left endpoints. L = (c) By looking at a sketch of the graph and the rectangles, determine for each estimate whether is overestimates, underestimates, or is the exact area. ? 1. R4 42. L
 Estimate the area under the graph of f(x) rectangles and right endpoints. 1 over the interval [ - 2, 3] using ten approximating +3 RE Repeat the approximation using left endpoints. Ln = Report answers accurate to 4 places. Remember not to round too early in your calculations.
 PLEASE SHOW WORK WITH CLEAR
STEPS
11. f (x) 5- x2 Estimate the area under the graph from x1 to x 2 using three rectangles and right endpoints. Then improve your estimate by using six rectangles. Sketch the curve and the approximating rectangles. ее
11. f (x) 5- x2 Estimate the area under the graph from x1 to x 2 using three rectangles and right endpoints. Then improve your estimate by using six rectangles. Sketch the curve and the approximating...
PLEASE SHOW WORK WITH CLEAR
STEPS
11. f (x) 5- x2 Estimate the area under the graph from x1 to x 2 using three rectangles and right endpoints. Then improve your estimate by using six rectangles. Sketch the curve and the approximating rectangles. ее
11. f (x) 5- x2 Estimate the area under the graph from x1 to x 2 using three rectangles and right endpoints. Then improve your estimate by using six rectangles. Sketch the curve and the approximating...
 MY NOTES 5. - 6 POINTS SCALCLS15.1.004. (*) Estimate the area under the graph of 4 rectangles and right a r ound your answers to four decimal places) Sketch the graph and the rectangle 6 f(x) = 45 f(x) 4x Is your estimate an underestimate or an overestimate overestimate underestimate (b) Repeat part (a) using left endpoints. Sketch the graph and the rectangles. Sketch the graph and the rectangles. of f(x) = 45 6 f(x) = 45 6 f(x) =...
 XN +4, from x= 1 to x=9 Approximate the area under the graph of f(x) and above the x-axis with rectangles, using the following methods with n = 4. (a) Use left endpoints. (b) Use right endpoints. (c) Average the answers in parts (a) and (b) (d) Use midpoints. . J. The area, approximated using the left endpoints, is (Round to two decimal places as needed.) The area, approximated using the right endpoints, is (Round to two decimal places as...
 answer all parts please
o y=x10 on [0, 2] ys(1 + x)22 on [1,3] Need Help? Hoad (a) Estimate the area under the graph of fx) -2 + 2x2 from x--1 to x -2 using three rectangles and right endpoints Then improve your estimate by using six rectangles. Sketch the curve and the approximating rectangles for R3 아 10 4 O Type here to search ⓘ슐 https://www.webassign.net/ eb Student/Assignment Responses ast?dep-211; eb 2.0 scientific cal.c..Periodic TableWorks.p... PBDAT breakdown (don.. kupdf.net...
answer all parts please
o y=x10 on [0, 2] ys(1 + x)22 on [1,3] Need Help? Hoad (a) Estimate the area under the graph of fx) -2 + 2x2 from x--1 to x -2 using three rectangles and right endpoints Then improve your estimate by using six rectangles. Sketch the curve and the approximating rectangles for R3 아 10 4 O Type here to search ⓘ슐 https://www.webassign.net/ eb Student/Assignment Responses ast?dep-211; eb 2.0 scientific cal.c..Periodic TableWorks.p... PBDAT breakdown (don.. kupdf.net...
 (a) Estimate the area under the graph of f(x) = 4 + 4x2 from x = -1 to x = 2 using three rectangles and right endpoints. R3 = 32 Then improve your estimate by using six rectangles. RG :- 27.5 Sketch the curve and the approximating rectangles for R3. у 20 у 20 15 15 10 10 O-1 2 у у 20 20 15 15 10 10 5 -1 1 2 1 2 Sketch the curve and the approximating...
Most questions answered within 3 hours.
-
The extent to which assets are financed by borrowed funds and
other liabilities is indicated by:...
asked 5 minutes ago -
Explain in detail
Germany is the fifth largest economy
explain what goods and services Germany specializes...
asked 20 minutes ago -
The density of platinum is 21.45 g/mL. If a cube of platinum
with a mass of...
asked 25 minutes ago -
Accounts Receivable
Sales
A/R Posting
Extended Sales Invoice
Packing Slip
Compare invoice to packing slip 2...
asked 28 minutes ago -
Michaella, age 23, is a full-time law student and is claimed by
her parents as a...
asked 29 minutes ago -
Why are polymers not typically casted into products?
asked 46 minutes ago -
When rolling a die 129 times, what is the probability of rolling
a 6 no more...
asked 1 hour ago -
4. A call option currently sells for $7.75. It has a strike
price of $85 and...
asked 51 minutes ago -
1.
You need to prepare 10.0 liters of an acid aqueous solution with a
pH of...
asked 54 minutes ago -
Along an aggregate supply curve, if the level of output is less
than the natural level...
asked 55 minutes ago -
By 2025, annual consumption in emerging markets will total $30
trillion and contribute more than ________...
asked 1 hour ago -
At what point does reformation cease to be a viable option for
those who are oppressed...
asked 1 hour ago