
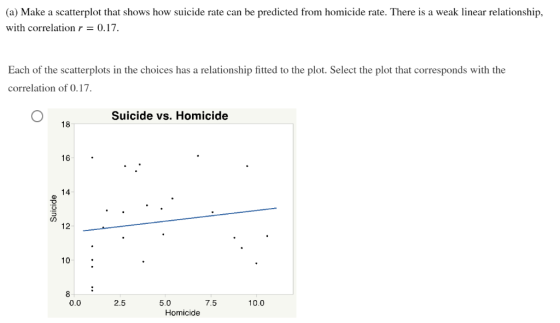
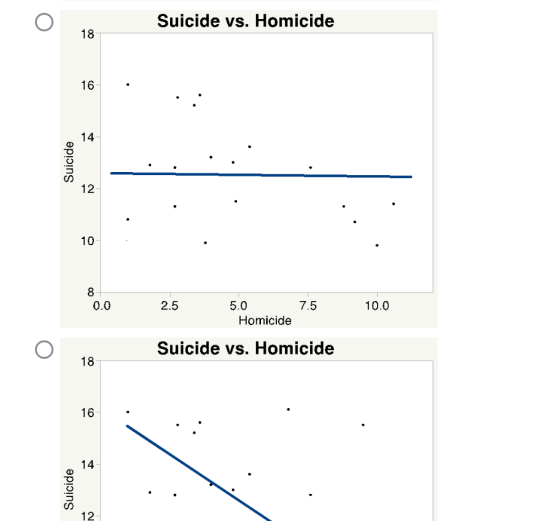
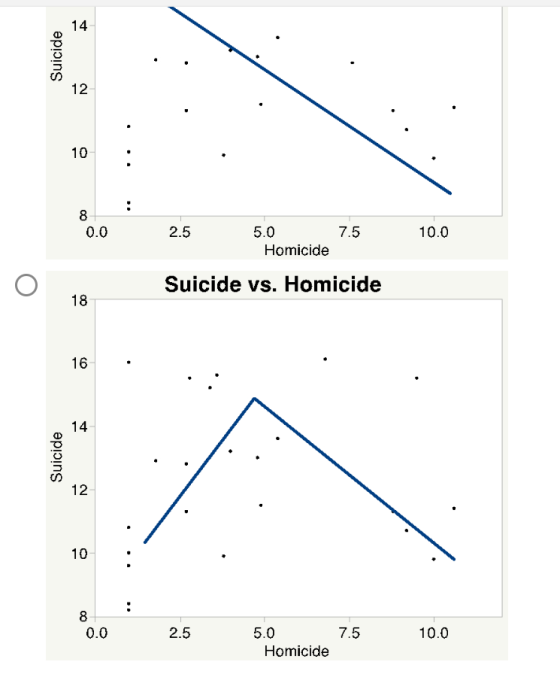


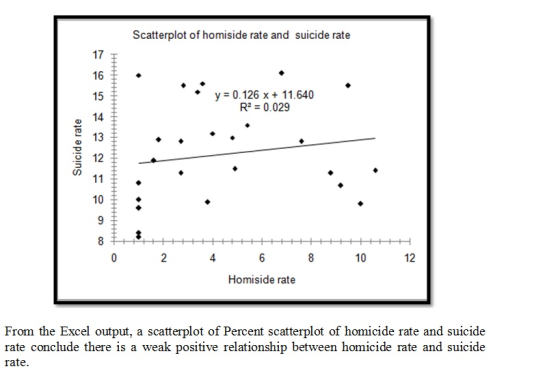
(a) Make a scatterplot that shows how suicide rate can be predicted from homicide rate. There is a weak linear relationship. with correlation r0.17 Each of the scatterplots in the choices has a relationship fitted to the plot. Select the plot that corresponds with the correlation of 0.17 Suicide vs. Homicide 18 16 14 C0 12 10 8 2.5 5.0 10.0 0.0 7.5 Homicide
Suicide vs. Homicide 18 16. 14 12 10 8 10.0 7.5 5.0 2.5 0.0 Homicide Suicide vs. Homicide 18 16. 14 12
14 12 10 8 7.5 10.0 2.5 5.0 0.0 Homicide Suicide vs. Homicide 18 16. 14 CO 12 10 8 10.0 7.5 2.5 5.0 0.0 Homicide
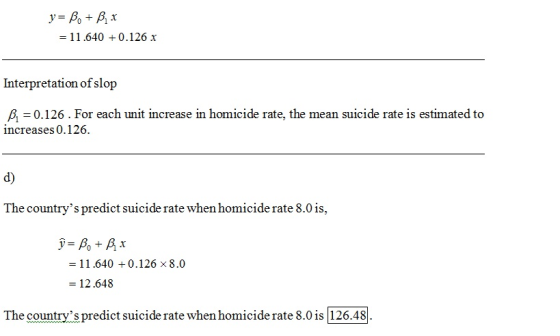
(b) Find the least-squares regression line for predicting suicide rate from homicide rate, a + b × homicide answers rounded to three decimal places.) Enter your (c) Explain in words what the slope of the regression line tells us. O The slope means that for every additional suicide (per 100,000 people), there is an average increase of 0.126 O The slope means that for every additional homicide (per 100,000 people), there is an average decrease of 0.126 O The slope means that for every additional homicide (per 100,000 people), there is an average increase of 0.126 O The slope means that for every additional homicide (per 100,000 people), there is an average increase of 11.640 O The slope means that for every additional homicide (per 100,000 people), there is an average decrease of 11.640 homicide (per 100,000 people) in these Ohio counties. suicide (per 100,000 people) in these Ohio counties. suicide (per 100,000 people) in these Ohio counties. suicides (per 100,000 people) in these Ohio counties. suicides (per 100,000 people) in these Ohio counties.
(d) Another Ohio county has a homicide rate of 8.0 per 100,000 people. What is the county's predicted suicide rate? (Enter your answer rounded to three decimal places.) Predicted suicide rate: per 100,000 people
Homework Answers
SOLUTION

Add Answer to:
Homicide and suicide are both intentional means of ending a life. However, the reason for committ...
Homicide and suicide are both intentional means of ending a life. However, the reason for committing...
Homicide and suicide are both intentional means of ending a life. However, the reason for committing a homicide is different from that for suicide and we might expect homicide and suicide rates to be uncorrelated. On the other hand, both can involve some degree of violence, so perhaps we might expect some level of correlation in the rates. The data from 2008–2011 for 26 counties in Ohio are shown in the table. Rates are per 100,000 people. County Homicide rate...
(a) Homicide and suicide are both intentional means of ending a life. However, the reason for...
 (a) Homicide and suicide are both intentional means of ending a life. However, the reason for committing a homicide is different from that for suicide, and we might expect homicide and suicide rates to be uncorrelated. On the other hand, both can involve some degree of violence, so perhaps we might expect some level of correlation in the rates. The data from 2008-2011 for 26 counties in Ohio. Rates are per 100,000 people is given in the table Homicide SuicideCounty...
(a) Homicide and suicide are both intentional means of ending a life. However, the reason for...
 (a) Homicide and suicide are both intentional means of ending a
life. However, the reason for committing a homicide is different
from that for suicide, and we might expect homicide and suicide
rates to be uncorrelated. On the other hand, both can involve some
degree of violence, so perhaps we might expect some level of
correlation in the rates. The data from 2008–2011 for 2626 counties
in Ohio. Rates are per 100,000100,000 people is given in the
table.
(a) Using...
(a) Homicide and suicide are both intentional means of ending a
life. However, the reason for committing a homicide is different
from that for suicide, and we might expect homicide and suicide
rates to be uncorrelated. On the other hand, both can involve some
degree of violence, so perhaps we might expect some level of
correlation in the rates. The data from 2008–2011 for 2626 counties
in Ohio. Rates are per 100,000100,000 people is given in the
table.
(a) Using...
 (a) Homicide and suicide are both intentional means of ending a life. However, the reason for committing a homicide is different from that for suicide, and we might expect homicide and suicide rates to be uncorrelated. On the other hand, both can involve some degree of violence, so perhaps we might expect some level of correlation in the rates. The data from 2008-2011 for 26 counties in Ohio. Rates are per 100,000 people is given in the table Homicide SuicideCounty...
 (a) Homicide and suicide are both intentional means of ending a
life. However, the reason for committing a homicide is different
from that for suicide, and we might expect homicide and suicide
rates to be uncorrelated. On the other hand, both can involve some
degree of violence, so perhaps we might expect some level of
correlation in the rates. The data from 2008–2011 for 2626 counties
in Ohio. Rates are per 100,000100,000 people is given in the
table.
(a) Using...
(a) Homicide and suicide are both intentional means of ending a
life. However, the reason for committing a homicide is different
from that for suicide, and we might expect homicide and suicide
rates to be uncorrelated. On the other hand, both can involve some
degree of violence, so perhaps we might expect some level of
correlation in the rates. The data from 2008–2011 for 2626 counties
in Ohio. Rates are per 100,000100,000 people is given in the
table.
(a) Using...
Most questions answered within 3 hours.
-
An entomologist discovers a dung beetle rolling a ball of dung
along the ground, and decides...
asked 1 hour ago -
Humans have used horses for transportation for millions of
years. Therefore, they will use horses for...
asked 3 hours ago -
The following are the Jensen Corporation's unit costs of making
and selling an item at a...
asked 3 hours ago -
Does direct Medicare reimbursement of Advanced practice nurses
increase access to their services?
asked 4 hours ago -
List and explain why a company would choose to use a
published
compensation survey vs. creating...
asked 4 hours ago -
A discrete random variable X can take values from 1 to 10. Find
the variance of...
asked 5 hours ago -
The primary financial goal of a corporation is to maximize:
shareholders wealth.
earnings per share.
stock...
asked 5 hours ago -
determine whether the vectors u=(1,2,3,), v=(-2,1,0) and
w=(1,0,1) are linearly dependent or independent.
asked 5 hours ago -
python
Define a function called print_values which takes a dictionary
object as a parameter. The function...
asked 6 hours ago -
In Chapter 1 you created a program named Triangle in
which you displayed a seven-line triangle...
asked 6 hours ago -
Research question: What are the differences between separately
stated and non separately stated transactions in an...
asked 6 hours ago -
By using Arduino write a code that connects two LEDs to two
push-buttons. Each button controls...
asked 7 hours ago