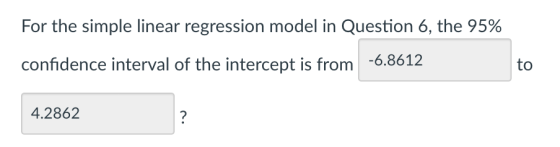
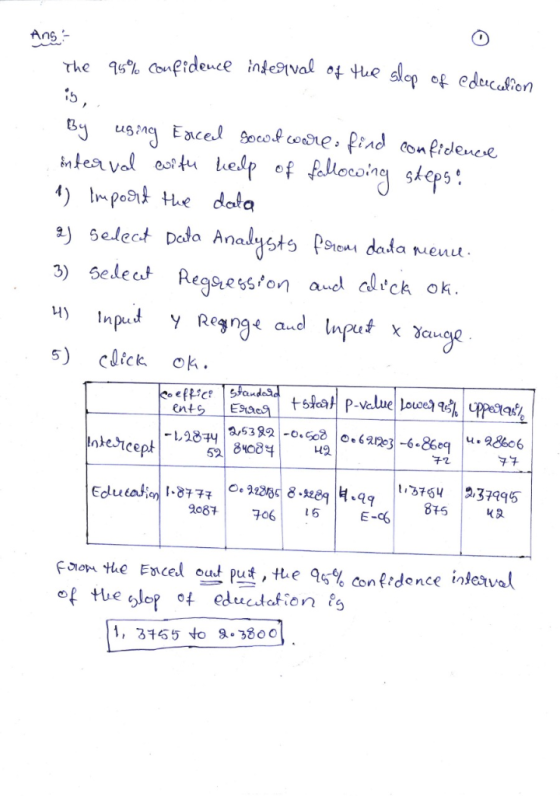
PLEASE USE PREDICTION INTERVAL INSTEAD OF JUST USING EXCEL
For the simple linear regression model in Question 6, the 95% to confidence interval of the intercept is from6.8612 4.2862
Homework Answers
Add Answer to:
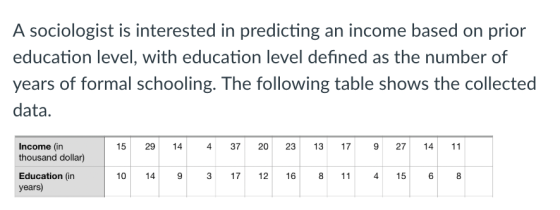
A sociologist is interested in predicting an income based on prior education level, with educatio...
A survey conducted by a research team was to investigate how the education level, tenure in...
A survey conducted by a research team was to investigate how the education level, tenure in current employment, and age are related to annual income. A sample of 20 employees is selected and the data are given below. Education (No. of years) Length of tenure in current employment (No. of years) Age (No. of years) Annual income ($) 17 8 40 124,000 12 12 41 30,000 20 9 44 193,000 14 4 42 88,000 12 1 19 27,000 14 9...
correlations and linear regression education and income 3. Use the following data set and complete the table. (Inc...
 correlations and linear regression education and income
3. Use the following data set and complete the table. (Income is the dependent variable and education is the independent variable) Education (Years) I x -* Yi- } (x; - x)(y;-)) (x; -x² Income ($1000) 15 46 13 17 58 46 13 10 40 63 15 18 11 9 11 15 45 12 50 16 9 14 48 58 14 16 50 11 a. Calculate x, y, and the standard deviations for both...
correlations and linear regression education and income
3. Use the following data set and complete the table. (Income is the dependent variable and education is the independent variable) Education (Years) I x -* Yi- } (x; - x)(y;-)) (x; -x² Income ($1000) 15 46 13 17 58 46 13 10 40 63 15 18 11 9 11 15 45 12 50 16 9 14 48 58 14 16 50 11 a. Calculate x, y, and the standard deviations for both...
A researcher wants to determine if the number of years of education that a person's father...
 A researcher wants to determine if the number of years of education that a person's father has ("paeduc") is related to the number of years of education that the person has ("educ"). He uses simple linear regression to examine this question. The output from Excel is shown below. Regression Statistics Multiple R 0.527393938 R Square 0.278144366 Adjusted R Square 0.264776669 Standard Error 2.436826202 Observations 56 ANOVA df F Significance F 2.96139E-05 20.8072 Regression Residual Total SS MS 123.555701 123.5557 320.6585847...
An engineering firm is interested in investigating whether the variability in the cost of small p...
 help solve (please show excel formula for part b)
An engineering firm is interested in investigating whether the variability in the cost of small projects (defined as projects under $10 million)can be accounted for, in part, by differences in the number of direct engineering consulting hours billed. A random sample of 20 small projects was selected from small projects performed over the past two years. The number of engineering consulting hours billed for each project, along with the project's cost...
help solve (please show excel formula for part b)
An engineering firm is interested in investigating whether the variability in the cost of small projects (defined as projects under $10 million)can be accounted for, in part, by differences in the number of direct engineering consulting hours billed. A random sample of 20 small projects was selected from small projects performed over the past two years. The number of engineering consulting hours billed for each project, along with the project's cost...
Help & explain please Regression 1. A researcher is willing to investigate whether there is any...
 Help & explain please
Regression 1. A researcher is willing to investigate whether there is any linear relation bet ween income (x) in thousand dollars and food expenditures (y) in hundred dollars. A sample data on 7 households given the table below was collected. Assuming that a linear model is used to solve the problem. r-3-D) r-I 83 24 13 61 15 17 1. Write down the linear model 2. Write down the fitted regression line and Interpret the slope...
Help & explain please
Regression 1. A researcher is willing to investigate whether there is any linear relation bet ween income (x) in thousand dollars and food expenditures (y) in hundred dollars. A sample data on 7 households given the table below was collected. Assuming that a linear model is used to solve the problem. r-3-D) r-I 83 24 13 61 15 17 1. Write down the linear model 2. Write down the fitted regression line and Interpret the slope...
3. A psychologist believed that as children get older, they engage in more “inactive activities” ...
3. A psychologist believed that as children get older, they engage in more “inactive activities” such as playing computer games, watching TV and surfing the internet. She collected data from 10 children. She recorded the age of each child and the amount of activity (in hours) the child engaged in per week. The table below gives the data for this hypothetical study (it is also available in activity.txt). Age (years) Amount of Activity (hours) 7 4.3 9 3.2 10 1.0...
Assignment 10 1. A random sample of 37 drivers insured with a company having similar auto...
 Assignment 10 1. A random sample of 37 drivers insured with a company having similar auto insurance policies) was selected The data table lists each of the driver's driving experience in years (DU), and their monthly auto insurance pre- miums in dollars (CU). A researcher wished to determine the following: Correlation: Experience (yrs) 1. On an a priori basis, would the researcher expect a positive or negative inverse) relationship between years driving experience and monthly insurance pre- miums? 4 4...
We are interested in the relationship between the compensation of Chief Executive Officers (CEO) ...
We are interested in the relationship between the compensation of Chief Executive Officers (CEO) of firms and the return on equity of their respective firm, using the dataset below. The variable salary shows the annual salary of a CEO in thousands of dollars, so that y = 150 indicates a salary of $150,000. Similarly, the variable ROE represents the average return on equity (ROE)for the CEO’s firm for the previous three years. A ROE of 20 indicates an average return...
In this exercise, you will investigate the relationship between a worker's age and earnings. (Generally, older...
 In this exercise, you will investigate the relationship between a worker's age and earnings. (Generally, older workers have more job experience, leading to higher productivity and earnings.) The following table contains data for full-time, full-years workers, age 25-34, with a high school diploma or B.A./B.S. as their highest degree. Download the data from the table by clicking the download table icon 0 . A detailed description of the variables used in the data set is available here Use a statistical...
The following ANOVA model is for a multiple regression model with two independent variables: Degrees of Sum of Mean Source Freedom Squares ...
 The following ANOVA model is for a multiple regression model
with two independent variables:
Degrees
of
Sum
of
Mean
Source
Freedom
Squares
Squares
F
Regression
2
60
Error
18
120
Total
20
180
Determine the Regression Mean Square (MSR):
Determine the Mean Square Error (MSE):
Compute the overall Fstat test statistic.
Is the Fstat significant at the 0.05 level?
A linear regression was run on auto sales relative to consumer
income. The Regression Sum of Squares (SSR) was 360 and...
The following ANOVA model is for a multiple regression model
with two independent variables:
Degrees
of
Sum
of
Mean
Source
Freedom
Squares
Squares
F
Regression
2
60
Error
18
120
Total
20
180
Determine the Regression Mean Square (MSR):
Determine the Mean Square Error (MSE):
Compute the overall Fstat test statistic.
Is the Fstat significant at the 0.05 level?
A linear regression was run on auto sales relative to consumer
income. The Regression Sum of Squares (SSR) was 360 and...
 correlations and linear regression education and income
3. Use the following data set and complete the table. (Income is the dependent variable and education is the independent variable) Education (Years) I x -* Yi- } (x; - x)(y;-)) (x; -x² Income ($1000) 15 46 13 17 58 46 13 10 40 63 15 18 11 9 11 15 45 12 50 16 9 14 48 58 14 16 50 11 a. Calculate x, y, and the standard deviations for both...
correlations and linear regression education and income
3. Use the following data set and complete the table. (Income is the dependent variable and education is the independent variable) Education (Years) I x -* Yi- } (x; - x)(y;-)) (x; -x² Income ($1000) 15 46 13 17 58 46 13 10 40 63 15 18 11 9 11 15 45 12 50 16 9 14 48 58 14 16 50 11 a. Calculate x, y, and the standard deviations for both...
 A researcher wants to determine if the number of years of education that a person's father has ("paeduc") is related to the number of years of education that the person has ("educ"). He uses simple linear regression to examine this question. The output from Excel is shown below. Regression Statistics Multiple R 0.527393938 R Square 0.278144366 Adjusted R Square 0.264776669 Standard Error 2.436826202 Observations 56 ANOVA df F Significance F 2.96139E-05 20.8072 Regression Residual Total SS MS 123.555701 123.5557 320.6585847...
 help solve (please show excel formula for part b)
An engineering firm is interested in investigating whether the variability in the cost of small projects (defined as projects under $10 million)can be accounted for, in part, by differences in the number of direct engineering consulting hours billed. A random sample of 20 small projects was selected from small projects performed over the past two years. The number of engineering consulting hours billed for each project, along with the project's cost...
help solve (please show excel formula for part b)
An engineering firm is interested in investigating whether the variability in the cost of small projects (defined as projects under $10 million)can be accounted for, in part, by differences in the number of direct engineering consulting hours billed. A random sample of 20 small projects was selected from small projects performed over the past two years. The number of engineering consulting hours billed for each project, along with the project's cost...
 Help & explain please
Regression 1. A researcher is willing to investigate whether there is any linear relation bet ween income (x) in thousand dollars and food expenditures (y) in hundred dollars. A sample data on 7 households given the table below was collected. Assuming that a linear model is used to solve the problem. r-3-D) r-I 83 24 13 61 15 17 1. Write down the linear model 2. Write down the fitted regression line and Interpret the slope...
Help & explain please
Regression 1. A researcher is willing to investigate whether there is any linear relation bet ween income (x) in thousand dollars and food expenditures (y) in hundred dollars. A sample data on 7 households given the table below was collected. Assuming that a linear model is used to solve the problem. r-3-D) r-I 83 24 13 61 15 17 1. Write down the linear model 2. Write down the fitted regression line and Interpret the slope...
 Assignment 10 1. A random sample of 37 drivers insured with a company having similar auto insurance policies) was selected The data table lists each of the driver's driving experience in years (DU), and their monthly auto insurance pre- miums in dollars (CU). A researcher wished to determine the following: Correlation: Experience (yrs) 1. On an a priori basis, would the researcher expect a positive or negative inverse) relationship between years driving experience and monthly insurance pre- miums? 4 4...
 In this exercise, you will investigate the relationship between a worker's age and earnings. (Generally, older workers have more job experience, leading to higher productivity and earnings.) The following table contains data for full-time, full-years workers, age 25-34, with a high school diploma or B.A./B.S. as their highest degree. Download the data from the table by clicking the download table icon 0 . A detailed description of the variables used in the data set is available here Use a statistical...
 The following ANOVA model is for a multiple regression model
with two independent variables:
Degrees
of
Sum
of
Mean
Source
Freedom
Squares
Squares
F
Regression
2
60
Error
18
120
Total
20
180
Determine the Regression Mean Square (MSR):
Determine the Mean Square Error (MSE):
Compute the overall Fstat test statistic.
Is the Fstat significant at the 0.05 level?
A linear regression was run on auto sales relative to consumer
income. The Regression Sum of Squares (SSR) was 360 and...
The following ANOVA model is for a multiple regression model
with two independent variables:
Degrees
of
Sum
of
Mean
Source
Freedom
Squares
Squares
F
Regression
2
60
Error
18
120
Total
20
180
Determine the Regression Mean Square (MSR):
Determine the Mean Square Error (MSE):
Compute the overall Fstat test statistic.
Is the Fstat significant at the 0.05 level?
A linear regression was run on auto sales relative to consumer
income. The Regression Sum of Squares (SSR) was 360 and...
Most questions answered within 3 hours.
-
Write a program to solve the Josephus problem, with the following
modification:
Sample Input:
./a.out n...
asked 1 hour ago -
At the start of a CD it is spinning at a rate of 525 rpm
(revolutions...
asked 2 hours ago -
4. Without doing any calculations, predict whether the observed
∆T would increase, decrease or remain the...
asked 3 hours ago -
Based on the range, which of the following sets of scores has
the greatest variability? 3,...
asked 4 hours ago -
Ripples in a pond travel at a velocity of 3 m/s with one peak
passing a...
asked 4 hours ago -
A man stands on the roof of a building of height 13.0 mm and
throws a...
asked 4 hours ago -
The extent to which assets are financed by borrowed funds and
other liabilities is indicated by:...
asked 5 hours ago -
Explain in detail
Germany is the fifth largest economy
explain what goods and services Germany specializes...
asked 5 hours ago -
The density of platinum is 21.45 g/mL. If a cube of platinum
with a mass of...
asked 6 hours ago -
Accounts Receivable
Sales
A/R Posting
Extended Sales Invoice
Packing Slip
Compare invoice to packing slip 2...
asked 6 hours ago -
Michaella, age 23, is a full-time law student and is claimed by
her parents as a...
asked 6 hours ago -
Why are polymers not typically casted into products?
asked 6 hours ago