

please answer all fill in the blank
Vaianice (Chapter Aplia: Student Question Aplia: Assignment Aplia: Student Ques Away-facing Parent-facing 102.9 2,513.84 You decide to use an ANOVA at a .05 to test the null hypothesis that there is no difference between the The ANOVA table follows. Calculate the F-ratio and enter it into the table. ANOVA Table Source of Variation Between Treatments Within Treatments Total Degrees of Freedom Sum of Squares 662.70 4,301.50 4,964.20 Mean SquareF 662.70 28 153.63 5.78 4.31 1.54 0.23 29 Use the Distributions tool that follows to find Fcritical at a significance level of critical region for the F-ratio test statistic. a .05, the value of F that bounds the F Distribution Numerator Degrees of Freedom 26 Denominator Degrees of Freedom 26 .5000 5000 0.00 1.00 1.000 2.003.004.005.006.007.008.00
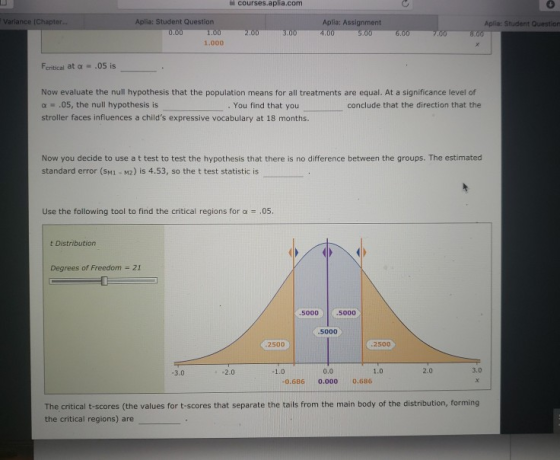
courses.aplia.com 0 Variance (Chapter.. Aplia: Student Question Aplia: Assignment Aplia: Student Question 1.000 .05 is Fcritical at α Now evaluate the null hypothesis that the population means for all treatments are equal. At a significance level of α-.05, the null hypothesis is stroller faces influences a child's expressive vocabulary at 18 months. . You find that you conclude that the direction that the Now you decide to use a t test to test the hypothesis that there is no difference between the groups. The estimated standard error (Smi-M2) is 4.53, so the t test statistic is Use the following tool to find the critical regions for α = .05. Degrees of Freedom 21 5000 5000 5000 2500 2500 0.0 -0.686 0.000 0.686 2.0 3.0 1.0 3.0 2.0 The critical t-scores (the values for t-scores that separate the tails from the main body of the distribution, forming the critical regions) are
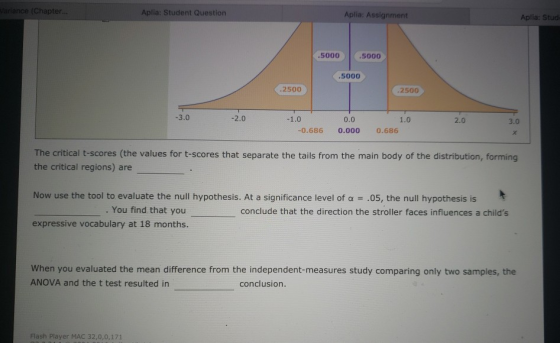
Variance (Chapter Aplia: Student Question Aplia: Assignment Aplia: Stud 5000 5000 5000 2500 -3.0 -2.0 0.0 1.0 2.0 3.0 0.686 0.000 0.686 The critical t-scores (the values for t-scores that separate the tails from the main body of the distribution, forming the critical regions) are Now use the tool to evaluate the null hypothesis. At a significance level of expressive vocabulary at 18 months. a .05, the null hypothesis is . You find that you conclude that the direction the stroller faces influences a child's When you evaluated the mean difference from the independent-measures study comparing only two samples, the ANOVA and the t test resulted in Flash Player MAC 32,0,0,171
Homework Answers
Test statistic
F = MS(between) / MS(Within) = 662.70/153.63 = 4.31
Fcritical at α = 0.05 is F.INV.RT(0.05, 1, 28) = 4.196
At a significance level of α = 0.05, the null hypothesis is rejected. You find that you can conclude that the direction that the stroller faces influences a child's expressive vocabulary at 18 months.
t test statistic:

df = 15+15-2 =28
the critical t score = T.INV.2T(0.05, 28) = +2.048, -2.048
At a significance level of α = 0.05, the null hypothesis is rejected. You find that you can conclude that the direction that the stroller faces influences a child's expressive vocabulary at 18 months.
When you evaluated the mean difference from the independent-measures study comparing only two samples, the ANOVA and t test resulted in same conclusion.
Add Answer to:
Keep the Highest: Attempts: /4.5 7. Comparing ANOVA and the t test for an independent-measures hy...
Answers in blanks are not the actualy answers, just randomly chosen. plz help Now you decide...
 Answers
in blanks are not the actualy answers, just randomly chosen.
plz help
Now you decide to use a t test to test the hypothesis that there is no difference between the groups. The estimated standard error (SM1 M2) is 4.04, so the t test statistic is 2.43 Use the following tool to find the critical regions for α-.05. t Distribution Degrees of Freedom-21 .5197 4803 5000 2500 2500 0.0 0.05 0.686 3.0 2.0 1.0 1.0 2.0 3.0 0.686 The...
Answers
in blanks are not the actualy answers, just randomly chosen.
plz help
Now you decide to use a t test to test the hypothesis that there is no difference between the groups. The estimated standard error (SM1 M2) is 4.04, so the t test statistic is 2.43 Use the following tool to find the critical regions for α-.05. t Distribution Degrees of Freedom-21 .5197 4803 5000 2500 2500 0.0 0.05 0.686 3.0 2.0 1.0 1.0 2.0 3.0 0.686 The...
For either independent-measures or repeated-measures designs comparing two treatments, the mean difference can be evaluated with...
 For either independent-measures or repeated-measures designs comparing two treatments, the mean difference can be evaluated with either at test or an ANOVA. The two tests are related by the equation F=12. The following data are from a repeated-measures study: Person Difference Scores 3 I 4 2 3 7 M = 4.00 T = 16 SS = 14 Treatment II 7 11 6 10 M 8.50 T-34 SS = 17 3 3 Mo 4.50 SS = 27.00 Use a repeated-measures t...
Consider the following data from a repeated-measures design. You want to use a repeated-measures t test...
 Consider the following data from a repeated-measures design. You want to use a repeated-measures t test to test the null hypothesis H_0: mu_D = 0 (the null hypothesis states that the mean difference for the general population is zero). The data consist of five observations, each with two measurements, A and B, taken before and after a treatment. Assume the population of the differences in these measurements are normally distributed. Complete the following table by calculating the differences and the...
4. Repeated-measures ANOVA Aa Aa Suppose you are interested in studying whether lighting brightness affects spatial reasoning abilities. You decide to test spatial reasoning using completion time sco...
 4. Repeated-measures ANOVA Aa Aa Suppose you are interested in studying whether lighting brightness affects spatial reasoning abilities. You decide to test spatial reasoning using completion time scores for the paper-folding test with five people, repeating the test on each person with three different lighting levels (800, 1,000, and 1,200 lux) In this experiment, the null hypothesis is that: O There are no individual differences in the completion time means O The completion time mean for at least one lighting...
5. A step-by-step hypothesis test for a repeated-measures design Aa Aa E Consider the following data...
 5. A step-by-step hypothesis test for a repeated-measures design Aa Aa E Consider the following data from a repeated-measures design. You want to use a repeated-measures t test to test the null hypothesis Ho: Wp = 0 (the null hypothesis states that the mean difference for the general population is zero). The data consist of five observations, each with two measurements, A and B, taken before and after a treatment. Assume the population of the differences in these measurements are...
Looking for some help with this stats problem - will give good reviews! Attempts Average: /19...
 Looking for some help with this stats problem - will give good
reviews!
Attempts Average: /19 10. Comparing repeated-measures ANOVA to independent-measures ANOVA Aa Aa You are interested in studying how formal language exposure and deafness affect language acquisition. You want to compare three groups: a hearing group, a deaf group that began learning American Sign Language (ASL) before age 1, and a deaf group that did not begin learning ASL until age 1. You are trying to decide whether...
Looking for some help with this stats problem - will give good
reviews!
Attempts Average: /19 10. Comparing repeated-measures ANOVA to independent-measures ANOVA Aa Aa You are interested in studying how formal language exposure and deafness affect language acquisition. You want to compare three groups: a hearing group, a deaf group that began learning American Sign Language (ASL) before age 1, and a deaf group that did not begin learning ASL until age 1. You are trying to decide whether...
5. Hypothesis testing with ANOVA Aa Aa E Opinions about whether caffeine enhances test performance differ....
 5. Hypothesis testing with ANOVA Aa Aa E Opinions about whether caffeine enhances test performance differ. You design a study to test the impact of drinks with different caffeine contents on students' test-taking abilities. You choose 21 students at random from your introductory psychology course to participate in your study. You randomly assign each student to one of three drinks, each with a different caffeine concentration, such that there are seven students assigned to each drink. You then give each...
Question 86 Not yet answered For an independent-measures ANOVA comparing three treatments with a sample of...
 Question 86 Not yet answered For an independent-measures ANOVA comparing three treatments with a sample of n the critical value for the F-ratio using a = .05? 5 in each treatment, what is Points out of 100 P Flag Question Select one: O a. 3.74 b. 3.34 O c. 3.49 d. 3.88 Question 87 Not yet answered Determining the class standing (1st, 2nd, and so on) for the graduating seniors at a high school would involve measurement on a(n) —...
Opinions about whether caffeine enhances test performance differ. You design a study to test the impact...
 Opinions about whether caffeine enhances test performance differ. You design a study to test the impact of drinks with different caffeine contents on students' test-taking abilities. You choose 21 students at random from your introductory psychology course to participate in your study. You randomly assign each student to one of three drinks, each with a different caffeine concentration, such that there are seven students assigned to each drink. You then give each of them a plain capsule containing the precise...
LLLLLS. 6. A one-tailed hypothesis test for a repeated-measures design Here to learn more. Aa Aa...
 LLLLLS. 6. A one-tailed hypothesis test for a repeated-measures design Here to learn more. Aa Aa E A cognitive psychologist is interested in whether increasing reading speed improves comprehension. He has students complete a reading comprehension task before and after a six-week speed-reading course In the beginning of the study, a randomly selected group of 81 students scored an average of 102 points on the reading comprehension task. Since the sample size is larger than 30, the cognitive psychologist can...
 Answers
in blanks are not the actualy answers, just randomly chosen.
plz help
Now you decide to use a t test to test the hypothesis that there is no difference between the groups. The estimated standard error (SM1 M2) is 4.04, so the t test statistic is 2.43 Use the following tool to find the critical regions for α-.05. t Distribution Degrees of Freedom-21 .5197 4803 5000 2500 2500 0.0 0.05 0.686 3.0 2.0 1.0 1.0 2.0 3.0 0.686 The...
Answers
in blanks are not the actualy answers, just randomly chosen.
plz help
Now you decide to use a t test to test the hypothesis that there is no difference between the groups. The estimated standard error (SM1 M2) is 4.04, so the t test statistic is 2.43 Use the following tool to find the critical regions for α-.05. t Distribution Degrees of Freedom-21 .5197 4803 5000 2500 2500 0.0 0.05 0.686 3.0 2.0 1.0 1.0 2.0 3.0 0.686 The...
 For either independent-measures or repeated-measures designs comparing two treatments, the mean difference can be evaluated with either at test or an ANOVA. The two tests are related by the equation F=12. The following data are from a repeated-measures study: Person Difference Scores 3 I 4 2 3 7 M = 4.00 T = 16 SS = 14 Treatment II 7 11 6 10 M 8.50 T-34 SS = 17 3 3 Mo 4.50 SS = 27.00 Use a repeated-measures t...
 Consider the following data from a repeated-measures design. You want to use a repeated-measures t test to test the null hypothesis H_0: mu_D = 0 (the null hypothesis states that the mean difference for the general population is zero). The data consist of five observations, each with two measurements, A and B, taken before and after a treatment. Assume the population of the differences in these measurements are normally distributed. Complete the following table by calculating the differences and the...
 4. Repeated-measures ANOVA Aa Aa Suppose you are interested in studying whether lighting brightness affects spatial reasoning abilities. You decide to test spatial reasoning using completion time scores for the paper-folding test with five people, repeating the test on each person with three different lighting levels (800, 1,000, and 1,200 lux) In this experiment, the null hypothesis is that: O There are no individual differences in the completion time means O The completion time mean for at least one lighting...
 5. A step-by-step hypothesis test for a repeated-measures design Aa Aa E Consider the following data from a repeated-measures design. You want to use a repeated-measures t test to test the null hypothesis Ho: Wp = 0 (the null hypothesis states that the mean difference for the general population is zero). The data consist of five observations, each with two measurements, A and B, taken before and after a treatment. Assume the population of the differences in these measurements are...
 Looking for some help with this stats problem - will give good
reviews!
Attempts Average: /19 10. Comparing repeated-measures ANOVA to independent-measures ANOVA Aa Aa You are interested in studying how formal language exposure and deafness affect language acquisition. You want to compare three groups: a hearing group, a deaf group that began learning American Sign Language (ASL) before age 1, and a deaf group that did not begin learning ASL until age 1. You are trying to decide whether...
Looking for some help with this stats problem - will give good
reviews!
Attempts Average: /19 10. Comparing repeated-measures ANOVA to independent-measures ANOVA Aa Aa You are interested in studying how formal language exposure and deafness affect language acquisition. You want to compare three groups: a hearing group, a deaf group that began learning American Sign Language (ASL) before age 1, and a deaf group that did not begin learning ASL until age 1. You are trying to decide whether...
 5. Hypothesis testing with ANOVA Aa Aa E Opinions about whether caffeine enhances test performance differ. You design a study to test the impact of drinks with different caffeine contents on students' test-taking abilities. You choose 21 students at random from your introductory psychology course to participate in your study. You randomly assign each student to one of three drinks, each with a different caffeine concentration, such that there are seven students assigned to each drink. You then give each...
 Question 86 Not yet answered For an independent-measures ANOVA comparing three treatments with a sample of n the critical value for the F-ratio using a = .05? 5 in each treatment, what is Points out of 100 P Flag Question Select one: O a. 3.74 b. 3.34 O c. 3.49 d. 3.88 Question 87 Not yet answered Determining the class standing (1st, 2nd, and so on) for the graduating seniors at a high school would involve measurement on a(n) —...
 Opinions about whether caffeine enhances test performance differ. You design a study to test the impact of drinks with different caffeine contents on students' test-taking abilities. You choose 21 students at random from your introductory psychology course to participate in your study. You randomly assign each student to one of three drinks, each with a different caffeine concentration, such that there are seven students assigned to each drink. You then give each of them a plain capsule containing the precise...
 LLLLLS. 6. A one-tailed hypothesis test for a repeated-measures design Here to learn more. Aa Aa E A cognitive psychologist is interested in whether increasing reading speed improves comprehension. He has students complete a reading comprehension task before and after a six-week speed-reading course In the beginning of the study, a randomly selected group of 81 students scored an average of 102 points on the reading comprehension task. Since the sample size is larger than 30, the cognitive psychologist can...
Most questions answered within 3 hours.
-
A statistics student finds herself struggling with a newspaper
article stating that only eighteen percent of...
asked 20 minutes ago -
People with beriberi, a disease caused by a thiamin deficiency,
have elevated levels of blood pyruvate...
asked 7 minutes ago -
PYTHON Programming Exercise 2: Create a Simple Cost Calculator
Write a program that displays input fields...
asked 13 minutes ago -
1.Seki agreed that Groupon could sell 18 hot air
balloon rides on his Magical Adventures company...
asked 14 minutes ago -
A cohort study is conducted to determine whether smoking is
associated with an increased risk of...
asked 19 minutes ago -
Create the pseudo-code/flowchart for an application class named
Monogram. Its main() method inputs three variables that...
asked 20 minutes ago -
How many liters of water are required to dissolve 1.00 g of
silver chromate? Express your...
asked 22 minutes ago -
Hot: T_inlet = 80, T_out = 65
Cold: T_inlet = 10, T_out = 25
Explain in...
asked 23 minutes ago -
Two protons fly in different directions and collide. They both
have a total energy of 1.5...
asked 32 minutes ago -
What is the oxidation number of each atom in sodium phosphate,
Na3PO4?
>>> SHOW YOUR WORK...
asked 38 minutes ago -
D company purchased goods with a list price of $60000, subject
to trade discounts of 20%...
asked 41 minutes ago -
Transposable elements make up more than 40% of the human genome
and are inserted more-or-less randomly...
asked 52 minutes ago