


Homework Answers

Add Answer to:
On the first day of class, an economics professor administers a test to gauge the math preparedne...
A standardized exam consists of three parts: math, writing, and critical reading. Sample data showing the...
A standardized exam consists of three parts: math, writing, and critical reading. Sample data showing the math and writing scores for a sample of 12 students who took the exam follow. Student Math Writing 1 540 474 2 432 380 3 528 463 4 574 612 5 448 420 6 502 526 7 480 430 8 499 459 9 610 615 10 572 541 11 390 335 12 593 613 (a) Use a 0.05 level of significance and test for...
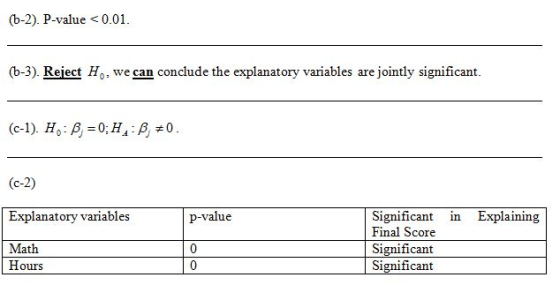
Problem 4: Variables that may affect Grades The data set contains a random sample of STAT 250 Final Exam Scores out of 80 points. For each individual sampled, the time (in hours per week) that the stu...
Problem 4: Variables that may affect Grades The data set contains a random sample of STAT 250 Final Exam Scores out of 80 points. For each individual sampled, the time (in hours per week) that the student spent participating in a GMU club or sport and working for pay outside of GMU was recorded. Values of 0 indicate the students either does not participate in a club or sport or does not work a job for pay. The goal of...
A statistics professor would like to build a model relating student scores on the first test...
A statistics professor would like to build a model relating student scores on the first test to the scores on the second test. The test scores from a random sample of 21 students who have previously taken the course are given in the table. Test Scores Student First Test Grade Second Test Grade 1 88 76 2 72 69 3 80 74 4 44 64 5 71 77 6 50 66 7 98 86 8 78 78 9 73 78...
For a sample of 20 New England cities, a sociologist studies the crime rate in each...
For a sample of 20 New England cities, a sociologist studies the crime rate in each city (crimes per 100,000 residents) as a function of its poverty rate (in %) and its median income (in $1,000s). A portion of the regression results is shown in the accompanying table. Use Table 2 and Table 4. ANOVA df SS MS F Significance F Regression 2 2,517.3 1,258.6 7.49E-01 Residual 17 72,837.53 4,284.56 Total 19 75,354.80 Coefficients...
IC Price Income Temp Lag-temp 0.386 0.27 78 41 56 0.374 0.282 79 56 63 0.393...
IC Price Income Temp Lag-temp 0.386 0.27 78 41 56 0.374 0.282 79 56 63 0.393 0.277 81 63 68 0.425 0.28 80 68 69 0.406 0.272 76 69 65 0.344 0.262 78 65 61 0.327 0.275 82 61 47 0.288 0.267 79 47 32 0.269 0.265 76 32 24 0.256 0.277 79 24 28 0.286 0.282 82 28 26 0.298 0.27 85 26 32 0.329 0.272 86 32 40 0.318 0.287 83 40 55 0.381 0.277 84 55 63...
the data below are the final exam scores of 10 randomly selected statistics students and the...
 the
data below are the final exam scores of 10 randomly selected
statistics students and the number of hours they studied for the
exam. What is the best predicted value for the exam score for a
student who stuided 2 hours? Assume that the varibles x and y have
a significant correlation.
Question 10 1 pts The data below are the final exam scores of 10 randomly selected statistics students and the number of hours they studied for the exam....
the
data below are the final exam scores of 10 randomly selected
statistics students and the number of hours they studied for the
exam. What is the best predicted value for the exam score for a
student who stuided 2 hours? Assume that the varibles x and y have
a significant correlation.
Question 10 1 pts The data below are the final exam scores of 10 randomly selected statistics students and the number of hours they studied for the exam....
An experiment is conducted to determine if classes offered in an online format are as effective a...
An experiment is conducted to determine if classes offered in an online format are as effective as classes offered in a traditional classroom setting. Students were randomly assigned to one of the two teaching methods. Data below. a. Test the claim that the standard deviations for the two groups are equal. What is the p-value of the test? b. Construct a 95% confidence interval on the difference in expected final exam scores between the two groups. Does the data support...
Please answer all questions! thanks :) VI/ Test scores from a math midterm are as follows:...
 Please
answer all questions! thanks :)
VI/ Test scores from a math midterm are as follows: 79, 90, 85, 89, 70, 59, 75, 64, 83, 78, 75, 77, 78, 77, 67, 85, 74, 52, 87, 72, 69, 76, 61, 77, 93, 86, 79, 90, 74, 67, 51, 75, 77, 82, 78, 60, 86, 72, 91, 95, 82 Complete the frequency distribution table to include all data a. Class Tallies Class Midpoint Relative Cumulative Frequency relative freq boundaries Frequency 51 57...
Please
answer all questions! thanks :)
VI/ Test scores from a math midterm are as follows: 79, 90, 85, 89, 70, 59, 75, 64, 83, 78, 75, 77, 78, 77, 67, 85, 74, 52, 87, 72, 69, 76, 61, 77, 93, 86, 79, 90, 74, 67, 51, 75, 77, 82, 78, 60, 86, 72, 91, 95, 82 Complete the frequency distribution table to include all data a. Class Tallies Class Midpoint Relative Cumulative Frequency relative freq boundaries Frequency 51 57...
A client wants to determine whether there is a significant difference in the time required to...
A client wants to determine whether there is a significant difference in the time required to complete a program evaluation with the three different methods that are in common use. Suppose the times (in hours) required for each of 18 evaluators to conduct a program evaluation follow. Method 1 Method 2 Method 3 69 63 59 72 71 65 66 76 67 78 69 55 75 73 57 73 70 63 Use α = 0.05 and test to see whether...
A professor wishes to test a claim that the mean test score of her first class...
A professor wishes to test a claim that the mean test score of her first class is lower than the mean test score of her second class. A random sample of size 27 with a mean of 65.7 and a standard deviation of 5.4 is selected from her first class. A random sample of size 20 with a mean of 69.5 and a standard deviation of 12.1 is selected from her second class. Assume that test scores in both classes...
 the
data below are the final exam scores of 10 randomly selected
statistics students and the number of hours they studied for the
exam. What is the best predicted value for the exam score for a
student who stuided 2 hours? Assume that the varibles x and y have
a significant correlation.
Question 10 1 pts The data below are the final exam scores of 10 randomly selected statistics students and the number of hours they studied for the exam....
the
data below are the final exam scores of 10 randomly selected
statistics students and the number of hours they studied for the
exam. What is the best predicted value for the exam score for a
student who stuided 2 hours? Assume that the varibles x and y have
a significant correlation.
Question 10 1 pts The data below are the final exam scores of 10 randomly selected statistics students and the number of hours they studied for the exam....
 Please
answer all questions! thanks :)
VI/ Test scores from a math midterm are as follows: 79, 90, 85, 89, 70, 59, 75, 64, 83, 78, 75, 77, 78, 77, 67, 85, 74, 52, 87, 72, 69, 76, 61, 77, 93, 86, 79, 90, 74, 67, 51, 75, 77, 82, 78, 60, 86, 72, 91, 95, 82 Complete the frequency distribution table to include all data a. Class Tallies Class Midpoint Relative Cumulative Frequency relative freq boundaries Frequency 51 57...
Please
answer all questions! thanks :)
VI/ Test scores from a math midterm are as follows: 79, 90, 85, 89, 70, 59, 75, 64, 83, 78, 75, 77, 78, 77, 67, 85, 74, 52, 87, 72, 69, 76, 61, 77, 93, 86, 79, 90, 74, 67, 51, 75, 77, 82, 78, 60, 86, 72, 91, 95, 82 Complete the frequency distribution table to include all data a. Class Tallies Class Midpoint Relative Cumulative Frequency relative freq boundaries Frequency 51 57...
Most questions answered within 3 hours.
-
Q1b. Provide an example of how pricing should interact
with the services offered by the retailer.
asked 21 minutes ago -
a mass weighing 8 pounds when attached to a spring, stretches
it 6 inches.the object is...
asked 28 minutes ago -
The following is part of the computer output from a regression
of monthly returns on Waterworks...
asked 33 minutes ago -
Bob Katz is purchasing a new Honda Pilot for $35,000. He is
financing $30,000 with a...
asked 36 minutes ago -
The equity holders of Super Nova, Inc. have 100 million of
equity in the firm. Because...
asked 35 minutes ago -
A sample of 240 observations is selected from a normal
population with a population standard deviation...
asked 52 minutes ago -
Write an (efficient) pseudocode for the implementation of each
of the following function prototypes (proper C...
asked 51 minutes ago -
Klingon Widgets, Inc., purchased new cloaking machinery three
years ago for $5.6 million. The machinery can...
asked 55 minutes ago -
Social work's goal of social betterment implies
A. That social workers should be models of good...
asked 52 minutes ago -
a
12 kg box sits on a horizontal table. a string with tension 30.4 N
pulls...
asked 53 minutes ago -
A circular coil of radius 0.120 m contains a single turn and is
located in a...
asked 1 hour ago -
help me out
Velocity v = גf, wavelength ג = v/f and
Relative frequency = frequency...
asked 1 hour ago