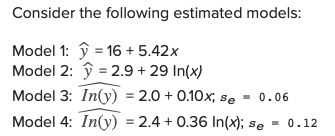

b. For each model, what is the predicted change in y when x increases by 4%, from 10 to 10.47 (Do not round intermediate calculations. Round final answers to 2 decimal places.) units units percent percent. Model 1:y increases Model 2: ý increases Model 3: increases Model 4:y increases by by by by
Homework Answers

Add Answer to:
Consider the following estimated models: Model 1: y-16 + 5.42x Model 2: y-29 + 29 In(x) Model 3: In(y) 2.0+0.10x, se 0.06 Model 4: In(y -2.4+0.36 In(; se 0.12 b. For each model, what is the predicted...
Consider the following estimated models: Model 1: yˆ = 14 + 7.34x Model 2: yˆ= 3.0 + 25...
Consider the following estimated models: Model 1: yˆ = 14 + 7.34x Model 2: yˆ= 3.0 + 25 In(x) Model 3: In(y)ˆ = 2.0 + 0.08x; se = 0.06 Model 4: In(y)ˆ= 2.5 + 0.48 In(x); se = 0.16 a. Interpret the slope coefficient in each of the above estimated models, when x increases by one unit in Models 1 and 3 and by 1% in Models 2 and 4. (Round your answers to 2 decimal places.) increase or decrease Model 1:...
Consider the sample regressions for the linear, the logarithmic, the exponential, and the log-log models. For each of th...
 Consider the sample regressions for the linear, the logarithmic,
the exponential, and the log-log models. For each of the estimated
models, predict y when x equals 50. (Do
not round intermediate calculations. Round final answers to 2
decimal places.)
Response Variable: y
Response Variable: ln(y)
Model 1
Model 2
Model 3
Model 4
Intercept
18.52
−6.74
1.48
1.02
x
1.68
NA
0.06
NA
ln(x)
NA
29.96
NA
0.96
se
23.92
19.71
0.12
0.10
Model 1 Model 2 Model 3 Model...
Consider the sample regressions for the linear, the logarithmic,
the exponential, and the log-log models. For each of the estimated
models, predict y when x equals 50. (Do
not round intermediate calculations. Round final answers to 2
decimal places.)
Response Variable: y
Response Variable: ln(y)
Model 1
Model 2
Model 3
Model 4
Intercept
18.52
−6.74
1.48
1.02
x
1.68
NA
0.06
NA
ln(x)
NA
29.96
NA
0.96
se
23.92
19.71
0.12
0.10
Model 1 Model 2 Model 3 Model...
Consider a binary response variable y and two explanatory variables xy and x2. The following table contains the parameter estimates of the linear probability model (LPM) and the logit model, wit...
 Consider a binary response variable y and two explanatory variables xy and x2. The following table contains the parameter estimates of the linear probability model (LPM) and the logit model, with the associated p-values shown in parentheses. Constant .40 -2.30 x1 x2 0.06 (0.03) 0.36 0.90 (0.03)(0.07) -0.03-0.10 (0.02) (0.01) a. At the 5% significance level, comment on the significance of the variables for both models. Logit gnificant 0 (Not significant x1 x2 b. What is the predicted probability implied...
Consider the sample regressions for the linear (Model 1), the logarithmic (Model 2), the exponential (Model...
 Consider the sample regressions for the linear (Model 1), the logarithmic (Model 2), the exponential (Model 3), and the log-log (Model 4) models. For each of the estimated models, predict y when x equals 50. (Do not round intermediate calculations. Round your answers to 2 decimal places.) Response Variable: y Response Variable: In(y) Model 18.52 1.68 NA 23.92 Model 2 -6.74 NA 29.96 19.71 Model 3 1.48 0.06 NA 0.12 Model 4 1.02 NA 0.96 0.10 Intercept In(x) 102.52 Model...
Consider the following estimated trend models. Use them to make a forecast for t= 24. a....
 Consider the following estimated trend models. Use them to make a forecast for t= 24. a. Linear Trend: = 11.64 + 1.04t (Round intermediate calculations to at least 4 decimal places and final answer to 2 decimal places.) Ў b. Quadratic Trend: û = 19.26 + 0.88t - 0.0172 (Round intermediate calculations to at least 4 decimal places and final answer to 2 decimal places.) 9 c. Exponential Trend: In(y) = 2.4 +0.06t, se = 0.01 (Round intermediate calculations to...
7 Consider the following regression output involving the variables y and, rı, r2. (note log is the natural logarithm as usual) 4.12 0.88 r Model A: Model B: log(y)0.34 0.14 + 0.001 2 Model C: logly)2...
 7 Consider the following regression output involving the variables y and, rı, r2. (note log is the natural logarithm as usual) 4.12 0.88 r Model A: Model B: log(y)0.34 0.14 + 0.001 2 Model C: logly)2011.4 log()0.02 r2 0.06 Model D: Model E: y = 5.4 + 0.82i --3.4 55.1 log(0.020 2 + 1.2r2 0.2 (1x2) Ceteris Paribus: (a) In Model A: If x1 increases 6 to 8 by 2 units, then the predicted change in y is Δy =...
Consider the following sample regressions for the linear, the quadratic, and the cubic models along with...
 Consider the following sample regressions for the linear, the quadratic, and the cubic models along with their respective R2 and adjusted R2. Intercept х x2 Linear 28.53 0.12 NA NA Quadratic 28.80 0.01 0.01 Cubic 28.62 0.15 -0.02 -0.01 x3 NA R2 Adjusted R2 0.005 -0.021 0.006 -0.048 0.006 -0.077 a. Predict y for x = 2 and 4 with each of the estimated models. (Round intermediate calculations to at least 4 decimal places and final answers to 2 decimal...
Returns Year X Y 1 14 % 18% 2 28 29 0.41 3 10 points -...
 Returns Year X Y 1 14 % 18% 2 28 29 0.41 3 10 points - 21 4 -26 5 10 20 еВook Print Using the returns shown above, calculate the arithmetic average returns, the variances, and the standard deviations for X and Y. (Do not round intermediate calculations. Enter your average return and standard deviation as a percent rounded to 2 decimal places, e.g., 32.16, and round the variance to 5 decimal places, e.g., 32.16161.) References X Y Average...
Returns Year X Y 1 13% 18% 2 27 28 3 - 20 - 25 4...
 Returns Year X Y 1 13% 18% 2 27 28 3 - 20 - 25 4 8 10 5 10 19 Using the returns shown above, calculate the average returns, variances, and standard deviations for X and Y: (Do not round intermediate calculations. Round the final percent answers to 2 decimal places. The variances to 5 decimal places.) X Y Average returns Variances Standard deviations ОО
(Round all intermediate calculations to at least 4 decimal places.) Consider the following sample regressions for the linear, the quadratic, and the cubic models along with their respective R2 and adj...
(Round all intermediate calculations to at least 4 decimal places.) Consider the following sample regressions for the linear, the quadratic, and the cubic models along with their respective R2 and adjusted R2. Linear Quadratic Cubic Intercept 25.97 20.73 16.20 x 0.47 2.82 6.43 x2 NA −0.20 −0.92 x3 NA NA 0.04 R2 0.060 0.138 0.163 Adjusted R2 0.035 0.091 0.093 pictureClick here for the Excel Data File a. Predict y for x = 3 and 5 with each of the...
 Consider the sample regressions for the linear, the logarithmic,
the exponential, and the log-log models. For each of the estimated
models, predict y when x equals 50. (Do
not round intermediate calculations. Round final answers to 2
decimal places.)
Response Variable: y
Response Variable: ln(y)
Model 1
Model 2
Model 3
Model 4
Intercept
18.52
−6.74
1.48
1.02
x
1.68
NA
0.06
NA
ln(x)
NA
29.96
NA
0.96
se
23.92
19.71
0.12
0.10
Model 1 Model 2 Model 3 Model...
Consider the sample regressions for the linear, the logarithmic,
the exponential, and the log-log models. For each of the estimated
models, predict y when x equals 50. (Do
not round intermediate calculations. Round final answers to 2
decimal places.)
Response Variable: y
Response Variable: ln(y)
Model 1
Model 2
Model 3
Model 4
Intercept
18.52
−6.74
1.48
1.02
x
1.68
NA
0.06
NA
ln(x)
NA
29.96
NA
0.96
se
23.92
19.71
0.12
0.10
Model 1 Model 2 Model 3 Model...
 Consider a binary response variable y and two explanatory variables xy and x2. The following table contains the parameter estimates of the linear probability model (LPM) and the logit model, with the associated p-values shown in parentheses. Constant .40 -2.30 x1 x2 0.06 (0.03) 0.36 0.90 (0.03)(0.07) -0.03-0.10 (0.02) (0.01) a. At the 5% significance level, comment on the significance of the variables for both models. Logit gnificant 0 (Not significant x1 x2 b. What is the predicted probability implied...
 Consider the sample regressions for the linear (Model 1), the logarithmic (Model 2), the exponential (Model 3), and the log-log (Model 4) models. For each of the estimated models, predict y when x equals 50. (Do not round intermediate calculations. Round your answers to 2 decimal places.) Response Variable: y Response Variable: In(y) Model 18.52 1.68 NA 23.92 Model 2 -6.74 NA 29.96 19.71 Model 3 1.48 0.06 NA 0.12 Model 4 1.02 NA 0.96 0.10 Intercept In(x) 102.52 Model...
 Consider the following estimated trend models. Use them to make a forecast for t= 24. a. Linear Trend: = 11.64 + 1.04t (Round intermediate calculations to at least 4 decimal places and final answer to 2 decimal places.) Ў b. Quadratic Trend: û = 19.26 + 0.88t - 0.0172 (Round intermediate calculations to at least 4 decimal places and final answer to 2 decimal places.) 9 c. Exponential Trend: In(y) = 2.4 +0.06t, se = 0.01 (Round intermediate calculations to...
 7 Consider the following regression output involving the variables y and, rı, r2. (note log is the natural logarithm as usual) 4.12 0.88 r Model A: Model B: log(y)0.34 0.14 + 0.001 2 Model C: logly)2011.4 log()0.02 r2 0.06 Model D: Model E: y = 5.4 + 0.82i --3.4 55.1 log(0.020 2 + 1.2r2 0.2 (1x2) Ceteris Paribus: (a) In Model A: If x1 increases 6 to 8 by 2 units, then the predicted change in y is Δy =...
 Consider the following sample regressions for the linear, the quadratic, and the cubic models along with their respective R2 and adjusted R2. Intercept х x2 Linear 28.53 0.12 NA NA Quadratic 28.80 0.01 0.01 Cubic 28.62 0.15 -0.02 -0.01 x3 NA R2 Adjusted R2 0.005 -0.021 0.006 -0.048 0.006 -0.077 a. Predict y for x = 2 and 4 with each of the estimated models. (Round intermediate calculations to at least 4 decimal places and final answers to 2 decimal...
 Returns Year X Y 1 14 % 18% 2 28 29 0.41 3 10 points - 21 4 -26 5 10 20 еВook Print Using the returns shown above, calculate the arithmetic average returns, the variances, and the standard deviations for X and Y. (Do not round intermediate calculations. Enter your average return and standard deviation as a percent rounded to 2 decimal places, e.g., 32.16, and round the variance to 5 decimal places, e.g., 32.16161.) References X Y Average...
 Returns Year X Y 1 13% 18% 2 27 28 3 - 20 - 25 4 8 10 5 10 19 Using the returns shown above, calculate the average returns, variances, and standard deviations for X and Y: (Do not round intermediate calculations. Round the final percent answers to 2 decimal places. The variances to 5 decimal places.) X Y Average returns Variances Standard deviations ОО
Most questions answered within 3 hours.
-
1.How large must the coefficient of static friction be between
the tires and the road if...
asked 12 minutes ago -
What is the time complexity (Big-O) of the following code?
class Main
{
// Recursive...
asked 12 minutes ago -
Economists look at any situation in terms of its component
parts: the people making decisions, the...
asked 18 minutes ago -
What is a population?
Select one:
a. All of the individual organisms belonging to the same...
asked 22 minutes ago -
You have a yeast cell culture with a concentration of 5x10^4
cells/ml. If you dilute this...
asked 26 minutes ago -
In which direction the Reaction goes? Show detailed process.
SeO3 + 2ClO2. + 2H3O <---> Se...
asked 39 minutes ago -
Unexposed silver halides are removed from photographic film when
they react with sodium thiosulfate
(Na2S2O3, called...
asked 40 minutes ago -
A 0.3054 gram sample of the mineral chalcopyrite (CuFeS2)
yielded 0.6525 gram BaSO4 precipitate. What is...
asked 40 minutes ago -
An short-seller in Tesla is worried the latest management
earnings forecast is too aggressive and the...
asked 1 hour ago -
Question 3 (1 point)
Fill in the blank. Speed Car Rental company found that the tire...
asked 1 hour ago -
1. A copper wire is 26.61 cm long and weighs 1.265 g. The
density of copper...
asked 1 hour ago -
Remember that a concept sketch consists of a sketch (or
series of sketches), labels, and complete...
asked 1 hour ago