
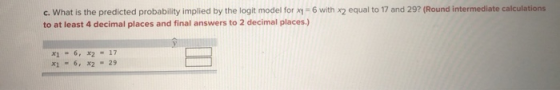
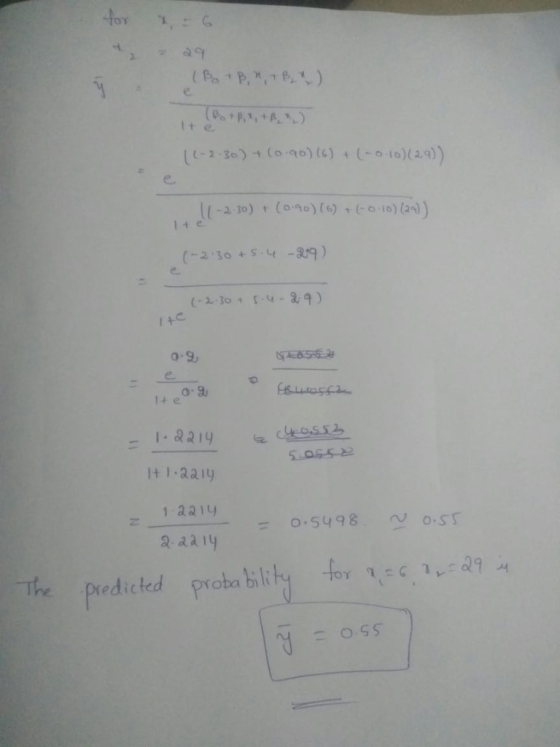
c. What is the predicted probability implied by the logit model for x1 6 with x2 equal to 17 and 29? (Round intermediate calculations to at least 4 decimal places and final answers to 2 decimal places.) x16, x2 17 1 -6,x2 29
Homework Answers

Add Answer to:
Consider a binary response variable y and two explanatory variables xy and x2. The following table contains the parameter estimates of the linear probability model (LPM) and the logit model, wit...
Consider a binary response variable y and two explanatory variables x1 and x2. The following table...
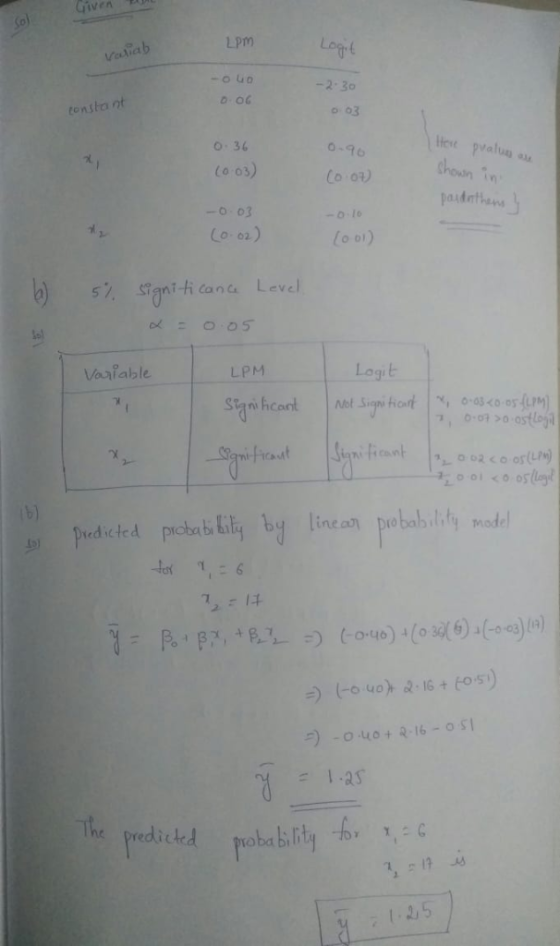
Consider a binary response variable y and two explanatory variables x1 and x2. The following table contains the parameter estimates of the linear probability model (LPM) and the logit model, with the associated p-values shown in parentheses. Variable LPM Logit Constant −0.60 −2.50 0.02 (0.03 ) x1 0.28 0.99 (0.06 ) (0.06 ) x2 −0.06 −0.30 (0.03 ) (0.06 ) a. At the 5% significance level, comment on the significance of the variables for both models. Variable LPM Logit x1...
Can someone help me with the work either by hand or using R? Thanks! Consider a...
 Can someone help me with the work either by hand or using R?
Thanks!
Consider a binary response variable y and an
explanatory variable x. The following table contains the
parameter estimates of the linear probability model (LPM) and the
logit model, with the associated p-values shown in
parentheses.
Variable
LPM
Logit
Constant
−0.69
−6.30
(0.06)
(0.06)
x
0.06
0.21
(0.04)
(0.06)
a. Test for the significance of the intercept and
the slope coefficients at the 5% level in both...
Can someone help me with the work either by hand or using R?
Thanks!
Consider a binary response variable y and an
explanatory variable x. The following table contains the
parameter estimates of the linear probability model (LPM) and the
logit model, with the associated p-values shown in
parentheses.
Variable
LPM
Logit
Constant
−0.69
−6.30
(0.06)
(0.06)
x
0.06
0.21
(0.04)
(0.06)
a. Test for the significance of the intercept and
the slope coefficients at the 5% level in both...
Use the following linear regression equation to answer the questions. x1 = 1.5 + 3.4x2 – 8.3x3 + 2.3x4 (a) Which variable is the response variable? Which variables are the explanatory variables? (b...
Use the following linear regression equation to answer the questions. x1 = 1.5 + 3.4x2 – 8.3x3 + 2.3x4 (a) Which variable is the response variable? Which variables are the explanatory variables? (b) Which number is the constant term? List the coefficients with their corresponding explanatory variables. constant? x2 coefficient? x3 coefficient? x4 coefficient? (c) If x2 = 1, x3 = 8, and x4 = 6, what is the predicted value for x1? (Use 1 decimal place.) (d) Explain how...
Consider the following data for a dependent variable y and two independent variables, x1 and x2...
Consider the following data for a dependent variable y and two independent variables, x1 and x2 . x1 x2 y 30 12 95 46 11 108 24 17 113 50 16 178 41 6 95 51 19 176 75 7 170 37 12 117 60 14 142 77 17 212 Round your all answers to two decimal places. Enter negative values as negative numbers, if necessary. a. Develop an estimated regression equation relating y to x1. y^ = ___ +...
Consider the following data for a dependent variable y and two independent variables, x1 and x2....
Consider the following data for a dependent variable y and two independent variables, x1 and x2. x1 x2 y 30 12 94 47 10 108 25 17 112 51 16 178 40 5 94 51 19 175 74 7 170 36 12 117 59 13 142 76 16 211 The estimated regression equation for the data is ŷ = −18.4 + 2.01x1 + 4.74x2. (a) Develop a 95% confidence interval for the mean value of y when x1 = 65...
Consider the following data for a dependent variable y and two independent variables, x1 and x2....
Consider the following data for a dependent variable y and two independent variables, x1 and x2. x1 x2 y 30 12 96 47 10 108 25 17 112 51 16 178 40 5 94 51 19 175 74 7 170 36 12 117 59 13 142 76 16 211 The estimated regression equation for these data is ŷ = −17.33 + 2.00x1 + 4.73x2. Here, SST = 15,002.1, SSR = 13,887.5, sb1 = 0.2454, and sb2 = 0.9417. Find the...
a) Find the multiple regression equation using all three explanatory variables. Assume that X1 is mid-term...
 a) Find the multiple regression equation using all three explanatory variables. Assume that X1 is mid-term score, X2 is hours studying per week and x3 is hours watching television per week. Give your answers to 3 decimal places. û = mid-term score + hours studying + hours watching television + b) At a level of significance of 0.05, the result of the F test for this model is that the null hypothesis rejected. c) The explanatory variable that is most...
Consider the following data for a dependent variable y and two independent variables, x1 and x2...
 Consider the following data for a dependent variable y and two independent variables, x1 and x2 30 12. 95 47 10 108 24 18 113 51 16 178 41 6 95 51 20 175 75 7 170 36 12 118 142 59 13 77 17 212 Round your all answers to two decimal places. Enter negative values as negative numbers, if necessary. a. Develop an estimated regression equation relating y to ai 1 Predict y if 1 = 45 b....
Consider the following set of dependent and independent variables. Complete parts a through c below. y 10 11 14 14 20 24 26 32 저15597121521 x2 17 11 13 11 2 8 6 4 a. Using technology, construct a re...
 Consider the following set of dependent and independent variables. Complete parts a through c below. y 10 11 14 14 20 24 26 32 저15597121521 x2 17 11 13 11 2 8 6 4 a. Using technology, construct a regression model using both independent variables. y = 1 3.5734 ) + ( 0.9496 ) x 1 + (-0.4001 ) x2 (Round to four decimal places as needed.) b. Test the significance of each independent variable using a 0.10. Test the...
Given the project information in the following table, what is the probability of completing the National...
 Given the project information in the following table, what is the probability of completing the National Holiday Toy project in 98-time units? Hint: Use the =NORM.S.DISTIZ, TRUE) function in Excel to compute the probability (Carry at least 3 decimal places in all intermediate calculations and the Z value. Enter your final probability answer to 3 decimal places.) (b) Acet. ID 1 2 3 4 5 6 7 Description Design package Design product Build package Secure patent Build product Paint Test...
 Can someone help me with the work either by hand or using R?
Thanks!
Consider a binary response variable y and an
explanatory variable x. The following table contains the
parameter estimates of the linear probability model (LPM) and the
logit model, with the associated p-values shown in
parentheses.
Variable
LPM
Logit
Constant
−0.69
−6.30
(0.06)
(0.06)
x
0.06
0.21
(0.04)
(0.06)
a. Test for the significance of the intercept and
the slope coefficients at the 5% level in both...
Can someone help me with the work either by hand or using R?
Thanks!
Consider a binary response variable y and an
explanatory variable x. The following table contains the
parameter estimates of the linear probability model (LPM) and the
logit model, with the associated p-values shown in
parentheses.
Variable
LPM
Logit
Constant
−0.69
−6.30
(0.06)
(0.06)
x
0.06
0.21
(0.04)
(0.06)
a. Test for the significance of the intercept and
the slope coefficients at the 5% level in both...
 a) Find the multiple regression equation using all three explanatory variables. Assume that X1 is mid-term score, X2 is hours studying per week and x3 is hours watching television per week. Give your answers to 3 decimal places. û = mid-term score + hours studying + hours watching television + b) At a level of significance of 0.05, the result of the F test for this model is that the null hypothesis rejected. c) The explanatory variable that is most...
 Consider the following data for a dependent variable y and two independent variables, x1 and x2 30 12. 95 47 10 108 24 18 113 51 16 178 41 6 95 51 20 175 75 7 170 36 12 118 142 59 13 77 17 212 Round your all answers to two decimal places. Enter negative values as negative numbers, if necessary. a. Develop an estimated regression equation relating y to ai 1 Predict y if 1 = 45 b....
 Consider the following set of dependent and independent variables. Complete parts a through c below. y 10 11 14 14 20 24 26 32 저15597121521 x2 17 11 13 11 2 8 6 4 a. Using technology, construct a regression model using both independent variables. y = 1 3.5734 ) + ( 0.9496 ) x 1 + (-0.4001 ) x2 (Round to four decimal places as needed.) b. Test the significance of each independent variable using a 0.10. Test the...
 Given the project information in the following table, what is the probability of completing the National Holiday Toy project in 98-time units? Hint: Use the =NORM.S.DISTIZ, TRUE) function in Excel to compute the probability (Carry at least 3 decimal places in all intermediate calculations and the Z value. Enter your final probability answer to 3 decimal places.) (b) Acet. ID 1 2 3 4 5 6 7 Description Design package Design product Build package Secure patent Build product Paint Test...
Most questions answered within 3 hours.
-
A steel wire in a piano has a length of 0.680 m and a mass of...
asked 2 hours ago -
Is validity and reliability tested by the following methods of
data analysis:
The questionnaires were coded...
asked 3 hours ago -
whats the relationship between toxoids and clostridium tetani and
botulinum?
asked 3 hours ago -
1)Explain what it means when demand is inelastic?
2) If demand is elastic, total revenue will...
asked 3 hours ago -
Jose is making quarterly contributions of of $210 to his savings
account which pays interest at...
asked 3 hours ago -
Rachel is pushing a box across the floor while Jon, at the same
time, is hoping...
asked 3 hours ago -
According to the Situational Leadership Model, which of the
following development levels works with a supporting...
asked 3 hours ago -
The Acme Trucking company has hired you to write software to
help dispatch its trucks. One...
asked 3 hours ago -
Write a script that uses four separate for loops to output the
following:
1 2 3...
asked 3 hours ago -
An instructor who taught two sections of engineering statistics
last term, the first with 20 students...
asked 3 hours ago -
A class consists of 15 boys and 12 girls. They want to elect
officers so that...
asked 3 hours ago -
The mean number of words per minute (WPM) typed by a speed
typist is 79 with...
asked 3 hours ago