
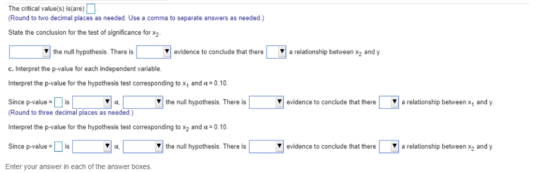
The critical value(s) is/are) Round to two decimal places as needed. Use a comma to separate answers as needed.) State the conclusion for the test of significance for x1 the null hypothesis. There is evidence to conclude that there a relationship between x1 and y. Test the significance of x2 Identify the null and alternative hypotheses. Type integers or decimals.) Calculate the appropriate test statistic. The test statistic is
The critical value(s) is(are) Round to two decimal places as needed. Use a comma to separate answers as needed.) State the conclusion for the test of significance for x2 ▼ the null hypothesis There is evidence to conclude that therea relationship between x2 and y c. Interpret the p-value for each independent variable nterpret the p-value for the hypothesis test corresponding to x1 anda0.0 ince p-valueis the null hypothesis. There is ' evidence to conclude that there | ▼| a relationship between x1 and y Round to three decimal places as needed.) Interpret the p-value for the hypothesis test corresponding to x2 and 010 9the nul hypothesis There Sincepeak"-Dis the null hypothesis. There is evidence to conclude that therea relationship between x2 and y Enter your answer in each of the answer boxes.
Homework Answers
using excel data analysis tool for regression, following o/p is
obtained
| SUMMARY OUTPUT | ||||||||
| Regression Statistics | ||||||||
| Multiple R | 0.960496 | |||||||
| R Square | 0.922553 | |||||||
| Adjusted R Square | 0.891574 | |||||||
| Standard Error | 2.607284 | |||||||
| Observations | 8 | |||||||
| ANOVA | ||||||||
| df | SS | MS | F | Significance F | ||||
| Regression | 2 | 404.8854 | 202.4427 | 29.78005 | 0.001669 | |||
| Residual | 5 | 33.98965 | 6.79793 | |||||
| Total | 7 | 438.875 | ||||||
| Coefficients | Standard Error | t Stat | P-value | Lower 95% | Upper 95% | Lower 95.0% | Upper 95.0% | |
| Intercept | 13.57335 | 4.251581 | 3.192543 | 0.024196 | 2.644317 | 24.50239 | 2.644317 | 24.50239 |
| X1 | 0.949587 | 0.214177 | 4.433665 | 0.006805 | 0.399029 | 1.500145 | 0.399029 | 1.500145 |
| X2 | -0.40008 | 0.277083 | -1.44391 | 0.208369 | -1.11235 | 0.312183 | -1.11235 | 0.312183 |
b)
the test statictic = 4.43
α=0.10
df=N-1 = 7
critical value= -1.89 and +1.89
since, test stat > critical value = 1.89, reject Ho
reject the null hypothesis, there is enough evidence to conclude
that there is a relationship between x1 and y
H0: ß2 = 0
H1: ß2 ╪0
test stat = -1.44
critical value= -1.89 and +1.89
do not reject the null hypothesis, there is not enough evidence to
conclude that there is a relationship between x2 and y
c) for x1
since, p-value=0.007 is less than α, reject the null
hypothesis.
there is enough evidence to conclude that there is a relationship
between x1 and y
for x2
since, p-value=0.208 is greater than α,do not reject the null
hypothesis.
there is not enough evidence to conclude that there is a
relationship between x1 and y
Add Answer to:
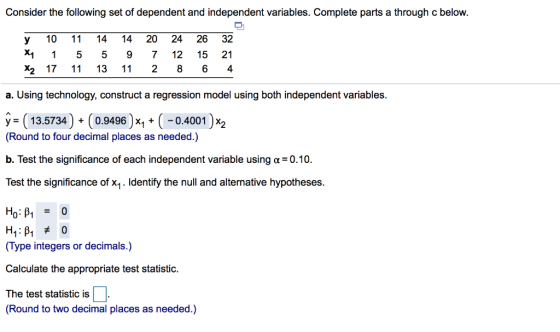
Consider the following set of dependent and independent variables. Complete parts a through c below. y 10 11 14 14 20 24 26 32 저15597121521 x2 17 11 13 11 2 8 6 4 a. Using technology, construct a re...
Consider the following set of deependent and independent variables. Complete parts a through c below. 11...
 Consider the following set of deependent and independent variables. Complete parts a through c below. 11 14 14 21 24 26 31 Y X1 1 8 10 15 21 4 4. 7 X2 16 9 13 11 2 8 8 4 CO b. Test the significance of each independent variable using a 0.10. Calculate the appropriate test statistic The test statistic (Round to two decimal places as needed.) What is the critical t-score? Use the t-test to determine the significance...
Consider the following data for a dependent variable y and two independent variables, x1 and x2....
Consider the following data for a dependent variable y and two independent variables, x1 and x2. x1 x2 y 30 12 96 47 10 108 25 17 112 51 16 178 40 5 94 51 19 175 74 7 170 36 12 117 59 13 142 76 16 211 The estimated regression equation for these data is ŷ = −17.33 + 2.00x1 + 4.73x2. Here, SST = 15,002.1, SSR = 13,887.5, sb1 = 0.2454, and sb2 = 0.9417. Find the...
Statistical software was used to fit the model E(y)Pox1 2x2 to n 20 data points. Complete parts a...
 Section 12.3 Multiple Linear Regression:
Number ONE:
Statistical software was used to fit the model E(y)Pox1 2x2 to n 20 data points. Complete parts a through h EEB Click the icon to see the software output. Data Table The regression equation is Y-1738.93 - 384.54x1 517.39x2 Predictor Constant X1 X2 Coef 1738.93 - 384.54 -517.39 SE Coef 369.06 101.65 - 3.78 0.002 353.04 - 1.47 0.162 4.71 0.000 s-172.003 R-sq-55.0% R-sq(adj):49.0% Analysis of Variance MS Source Regression Residual Error 17...
Section 12.3 Multiple Linear Regression:
Number ONE:
Statistical software was used to fit the model E(y)Pox1 2x2 to n 20 data points. Complete parts a through h EEB Click the icon to see the software output. Data Table The regression equation is Y-1738.93 - 384.54x1 517.39x2 Predictor Constant X1 X2 Coef 1738.93 - 384.54 -517.39 SE Coef 369.06 101.65 - 3.78 0.002 353.04 - 1.47 0.162 4.71 0.000 s-172.003 R-sq-55.0% R-sq(adj):49.0% Analysis of Variance MS Source Regression Residual Error 17...
Consider the following ANOVA table for a multiple regression model. Complete parts a through e be...
 *ANSWERS IN BOX ARE INCORRECT*
Consider the following ANOVA table for a multiple regression model. Complete parts a through e below. Source Regression 3 3,600 1200 20 Residual 35 2,100 60 Total df SSMSF 38 5,700 a. What is the size of this sample? n41 b. How many independent variables are in this model? c. Calculate the multiple coefficient of determination. R0.5882 Round to four decimal places as needed.) d. Test the significance of the overall regression model using α=0.05...
*ANSWERS IN BOX ARE INCORRECT*
Consider the following ANOVA table for a multiple regression model. Complete parts a through e below. Source Regression 3 3,600 1200 20 Residual 35 2,100 60 Total df SSMSF 38 5,700 a. What is the size of this sample? n41 b. How many independent variables are in this model? c. Calculate the multiple coefficient of determination. R0.5882 Round to four decimal places as needed.) d. Test the significance of the overall regression model using α=0.05...
11. Assume that the differences are normally distributed. Complete parts (a) through (d) below. Observation X...
 11. Assume that the differences are normally distributed. Complete parts (a) through (d) below. Observation X Y 1 52.6 53.3 2 52.5 3 44.4 4 44.0 48.4 5 55.1 6 464 7 478 50.5 B 50.4 52.6 51.8 49.5 54.3 49.2 (a) Determine d = XY, for each pair of data. 2 5 6 7 Observation d (Type integers or decimals.) (b) Computed and s. (Round to three decimal places as needed.) Sa (Round to three decimal places as needed.)...
14. Use the following information to complete steps (a) through (d) below. A random sample of...
 14. Use the following information to complete steps (a) through (d) below. A random sample of n = 135 individuals results in x1 = 40 successes. An independent sample of n2 = 140 individuals results in X2 = 60 successes. Does this represent sufficient evidence to conclude that p1 <P2 at the a=0.05 level of significance? (a) What type of test should be used? O A. A hypothesis test regarding the difference between two population proportions from independent samples. OB....
11. Assume that the differences are normally distributed. Complete parts (a) through (d) below. Observation 1...
 11. Assume that the differences are normally distributed. Complete parts (a) through (d) below. Observation 1 2 3 4 5 6 7 8 X 50.1 49.4 50.2 44.1 51.4 51.8 50.6 46.9 Y 53.5 49.3 53.3 48.2 51,2 51.7 54.4 48.5 (a) Determine d = X - Y, for each pair of data. 2 3 4 5 6 7 Observation 1 di (Type integers or decimals.) (b) Computed and sa da (Round to three decimal places as needed.) Sg =...
This Question: 1 pt 15 of 20 (10 complete) Consider the hypotheses below Ho μ:50 H1...
 This Question: 1 pt 15 of 20 (10 complete) Consider the hypotheses below Ho μ:50 H1 μ#50 Given that x-56. S-20. n-16, and -0.05, answer the questions below. a. What conclusion should be drawn? b. Use technology to determine the p-value for this test. a. Determine the critical value(s) The critical value(s) is(are) (Round to three decimal places as needed. Use a comma to separate answers as needed.) Determine the test statistic, t (Round to two decimal places as needed.)...
7. Assume that the differences are normally distributed. Complete parts (a) through (d) belovw Ob...
 7. Assume that the differences are normally distributed. Complete parts (a) through (d) belovw Observation 1 53.4 49.4 51.7 48.1 49.1 50.6 43.954.0 54.6 48.9 54.4 53.8 49.7 51.3 46.5 53.1 (a) Determine di =Xi-Yi for each pair of data Observation 4 (Type integers or decimals.) (b) Compute d and sd (Round to three decimal places as needed.) (Round to three decimal places as needed.) (c) Test itụd < 0 at the α-0.05 level of significance What are the correct...
Consider a multiple regression model of the dependent variable y on independent variables x1, X2, X3, and x4: Using data with n 60 observations for each of the variables, a student obtains the follow...
 Consider a multiple regression model of the dependent variable y on independent variables x1, X2, X3, and x4: Using data with n 60 observations for each of the variables, a student obtains the following estimated regression equation for the model given: y0.35 0.58x1 + 0.45x2-0.25x3 - 0.10x4 He would like to conduct significance tests for a multiple regression relationship. He uses the F test to determine whether a significant relationship exists between the dependent variable and He uses the t...
 Consider the following set of deependent and independent variables. Complete parts a through c below. 11 14 14 21 24 26 31 Y X1 1 8 10 15 21 4 4. 7 X2 16 9 13 11 2 8 8 4 CO b. Test the significance of each independent variable using a 0.10. Calculate the appropriate test statistic The test statistic (Round to two decimal places as needed.) What is the critical t-score? Use the t-test to determine the significance...
 Section 12.3 Multiple Linear Regression:
Number ONE:
Statistical software was used to fit the model E(y)Pox1 2x2 to n 20 data points. Complete parts a through h EEB Click the icon to see the software output. Data Table The regression equation is Y-1738.93 - 384.54x1 517.39x2 Predictor Constant X1 X2 Coef 1738.93 - 384.54 -517.39 SE Coef 369.06 101.65 - 3.78 0.002 353.04 - 1.47 0.162 4.71 0.000 s-172.003 R-sq-55.0% R-sq(adj):49.0% Analysis of Variance MS Source Regression Residual Error 17...
Section 12.3 Multiple Linear Regression:
Number ONE:
Statistical software was used to fit the model E(y)Pox1 2x2 to n 20 data points. Complete parts a through h EEB Click the icon to see the software output. Data Table The regression equation is Y-1738.93 - 384.54x1 517.39x2 Predictor Constant X1 X2 Coef 1738.93 - 384.54 -517.39 SE Coef 369.06 101.65 - 3.78 0.002 353.04 - 1.47 0.162 4.71 0.000 s-172.003 R-sq-55.0% R-sq(adj):49.0% Analysis of Variance MS Source Regression Residual Error 17...
 *ANSWERS IN BOX ARE INCORRECT*
Consider the following ANOVA table for a multiple regression model. Complete parts a through e below. Source Regression 3 3,600 1200 20 Residual 35 2,100 60 Total df SSMSF 38 5,700 a. What is the size of this sample? n41 b. How many independent variables are in this model? c. Calculate the multiple coefficient of determination. R0.5882 Round to four decimal places as needed.) d. Test the significance of the overall regression model using α=0.05...
*ANSWERS IN BOX ARE INCORRECT*
Consider the following ANOVA table for a multiple regression model. Complete parts a through e below. Source Regression 3 3,600 1200 20 Residual 35 2,100 60 Total df SSMSF 38 5,700 a. What is the size of this sample? n41 b. How many independent variables are in this model? c. Calculate the multiple coefficient of determination. R0.5882 Round to four decimal places as needed.) d. Test the significance of the overall regression model using α=0.05...
 11. Assume that the differences are normally distributed. Complete parts (a) through (d) below. Observation X Y 1 52.6 53.3 2 52.5 3 44.4 4 44.0 48.4 5 55.1 6 464 7 478 50.5 B 50.4 52.6 51.8 49.5 54.3 49.2 (a) Determine d = XY, for each pair of data. 2 5 6 7 Observation d (Type integers or decimals.) (b) Computed and s. (Round to three decimal places as needed.) Sa (Round to three decimal places as needed.)...
 14. Use the following information to complete steps (a) through (d) below. A random sample of n = 135 individuals results in x1 = 40 successes. An independent sample of n2 = 140 individuals results in X2 = 60 successes. Does this represent sufficient evidence to conclude that p1 <P2 at the a=0.05 level of significance? (a) What type of test should be used? O A. A hypothesis test regarding the difference between two population proportions from independent samples. OB....
 11. Assume that the differences are normally distributed. Complete parts (a) through (d) below. Observation 1 2 3 4 5 6 7 8 X 50.1 49.4 50.2 44.1 51.4 51.8 50.6 46.9 Y 53.5 49.3 53.3 48.2 51,2 51.7 54.4 48.5 (a) Determine d = X - Y, for each pair of data. 2 3 4 5 6 7 Observation 1 di (Type integers or decimals.) (b) Computed and sa da (Round to three decimal places as needed.) Sg =...
 This Question: 1 pt 15 of 20 (10 complete) Consider the hypotheses below Ho μ:50 H1 μ#50 Given that x-56. S-20. n-16, and -0.05, answer the questions below. a. What conclusion should be drawn? b. Use technology to determine the p-value for this test. a. Determine the critical value(s) The critical value(s) is(are) (Round to three decimal places as needed. Use a comma to separate answers as needed.) Determine the test statistic, t (Round to two decimal places as needed.)...
 7. Assume that the differences are normally distributed. Complete parts (a) through (d) belovw Observation 1 53.4 49.4 51.7 48.1 49.1 50.6 43.954.0 54.6 48.9 54.4 53.8 49.7 51.3 46.5 53.1 (a) Determine di =Xi-Yi for each pair of data Observation 4 (Type integers or decimals.) (b) Compute d and sd (Round to three decimal places as needed.) (Round to three decimal places as needed.) (c) Test itụd < 0 at the α-0.05 level of significance What are the correct...
 Consider a multiple regression model of the dependent variable y on independent variables x1, X2, X3, and x4: Using data with n 60 observations for each of the variables, a student obtains the following estimated regression equation for the model given: y0.35 0.58x1 + 0.45x2-0.25x3 - 0.10x4 He would like to conduct significance tests for a multiple regression relationship. He uses the F test to determine whether a significant relationship exists between the dependent variable and He uses the t...
Most questions answered within 3 hours.
-
Prepare journal entries to record the following four separate
issuances of stock.
A corporation issued 6,000...
asked 2 minutes ago -
A comet orbits the Sun every 8.67 years and reaches its
closest distance to the Sun...
asked 10 minutes ago -
Draw the structure of the compound: 1,1-diethyl-4-
(3,3-dimethylbutyl) cyclohexane.
asked 7 minutes ago -
An inductor with L = 9.70 mH is connected across an ac source
that has voltage...
asked 13 minutes ago -
Karsh has been breeding two different types of angel fish: a
common breed and a rare...
asked 31 minutes ago -
Job postings often state that the successful applicant
must have superior critical thinking and problem-solving skills....
asked 25 minutes ago -
What is the total cost of full ESP Pump equipments (down hole
equipment and upper surface...
asked 24 minutes ago -
cpp
Description
The purpose of this challenge is to use the for loops. This
challenge uses...
asked 32 minutes ago -
1. Drag the statements to the correct type of medium to compare
and contrast different examples...
asked 32 minutes ago -
"Please Solve Problem 2 Please"
Program 1(Total Point 15): You will use scanner class and ask...
asked 34 minutes ago -
If a counting standard has a mean activity of 400 cpm, what is
the probability of...
asked 35 minutes ago -
From the definition of torque in terms of angular momentum, ?
⃗=??/??, show that ??/??=−??/? where...
asked 35 minutes ago