

The F test conducted at significance level α-.05 is Use the Distributions tool to help you answer some of the questions that follow Select a Distribution Distributions 0 The following table shows the estimates of the model parameters with the relevant statistics. Complete the table by selecting the appropriate value and p-value for the t statistic for the test of B20 Parameter Estimates Parameter Standard Variable Estimate Error 0.20 0.38 0.50 0.20 0.17 t value p-value .0857 Constant 0.35 0.58 0.45 0.25 0.10 1.75 1.53 1317 X2 2166 1.25 X3 0.59 .5576 4
The t tests conducted at significance level α = .05 for each variable coefficient show that the following independent variables are significant: None of them O X1 and X2 2 only OX1, X2, and x3 The following table gives sample correlations between all possible pairings of variables in this model Sample Correlations X2 X3 X4 У 1.00 0.42 0.43-0.19-0.02 X1 0.42 1.00 0.74 -0.06 0.13 X2 0.43 0.74 1.00 -0.15 -0.03 X3 0.19 -0.06 1.00-0.14 0.15 0.14 1.00 X4-0.02 0.13 0.03 The sample correlation of -0.06 between x1 and x3, for example, is shown in the cell located at the x1 row and X3 column (or, equivalently, at the x3 row and x1 column) The table given shows that the independent variables X1 and x2 have substantial correlation with y. However, the t tests for individual significance show that correlated with each other, a phenomenon called significant. This is because X1 and X2 are
Homework Answers

Add Answer to:
Consider a multiple regression model of the dependent variable y on independent variables x1, X2, X3, and x4: Using data with n 60 observations for each of the variables, a student obtains the follow...
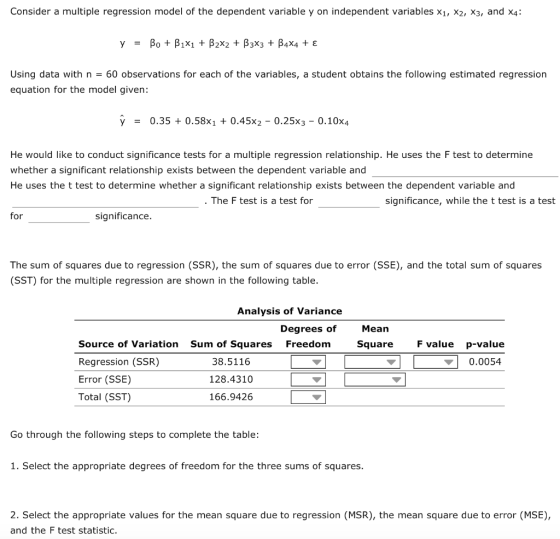
4. Testing for significance Aa Aa Consider a multiple regression model of the dependent variable y on independent variables x1, x2, X3, and x4: Using data with n = 60 observations for each of the var...
 4. Testing for significance Aa Aa Consider a multiple regression model of the dependent variable y on independent variables x1, x2, X3, and x4: Using data with n = 60 observations for each of the variables, a student obtains the following estimated regression equation for the model given: 0.04 + 0.28X1 + 0.84X2-0.06x3 + 0.14x4 y She would like to conduct significance tests for a multiple regression relationship. She uses the F test to determine whether a significant relationship exists...
Consider the multiple regression model shown next between the dependent variable Y and four independent variables...
Consider the multiple regression model shown next between the dependent variable Y and four independent variables X1, X2, X3, and X4, which result in the following function: Y = 33 + 8X1 – 6X2 + 16X3 + 18X4 For this multiple regression model, there were 35 observations: SSR= 1,400 and SSE = 600. Assume a 0.01 significance level. What is the predictions for Y if: X1 = 1, X2 = 2, X3 = 3, X4 = 0
Additional Problem A researcher collected data on Y and four X-variables: X1, X2, X3, X4, and he ...
 Additional Problem A researcher collected data on Y and four X-variables: X1, X2, X3, X4, and he wants to obtain a regression model. However, he is not sure if all the four X-variables should be included in the model. He provides you with the information shown below, namely, the SSR obtained when Y was regressed on each subset of X-variables. Also given: SST-100, and that the sample size is n 12. Your task Apply the Forward-Stepwise selection method, with a-to-enter-...
Consider a multiple regression model of the dependent variable y on independent variables x1, x2, and x3: Using data with n = 12 observations for each of the variables, a researcher obtains the follo...
 Consider a multiple regression model of the dependent variable y on independent variables x1, x2, and x3: Using data with n = 12 observations for each of the variables, a researcher obtains the following estimated regression equation for the above model y0.5216 + 1.2419x1 + 0.3049x2 - 0.0217x3 The standard error of estimate for this equation is s0.6489 The table below gives the values for the independent and dependent variables and their corresponding predicted values, residuals, and leverage Predicted Value...
A regression model was constructed by regressing Y on 5 explanatory variables, X1, X2, X3, X4,...
A regression model was constructed by regressing Y on 5 explanatory variables, X1, X2, X3, X4, and X5. There were n = 40 observations (rows) in the data set. In this case, the degrees of freedom (d.f.) for the error term in the model is:
Consider the following data for a dependent variable y and two independent variables, x1 and x2....
Consider the following data for a dependent variable y and two independent variables, x1 and x2. x1 x2 y 30 12 96 47 10 108 25 17 112 51 16 178 40 5 94 51 19 175 74 7 170 36 12 117 59 13 142 76 16 211 The estimated regression equation for these data is ŷ = −17.33 + 2.00x1 + 4.73x2. Here, SST = 15,002.1, SSR = 13,887.5, sb1 = 0.2454, and sb2 = 0.9417. Find the...
In a regression analysis involving 30 observations, the following estimated regression equation w...
In a regression analysis involving 30 observations, the following estimated regression equation was obtained. y=17.6+3.8x1-2.3x2+7.6x3+2.7x4 For this estimated regression equation SST= 1805 and SSR=1756. a. At a= 0.05 , test the significance of the relationship among the variables. SSE=_________________ (to 1 decimal, if necessary) MSR=________________ (to 1 decimal, if necessary) MSE=+_______________ (to 2 decimals, if necessary) What is the value of the F test statistic (to 1 decimal)? _______________ What is the p-value? - Select your answer -less than .01,between...
Using 3 variables and 13 observations, we are going to predict 'y. According to 0.05 significant...
 Using 3 variables and 13 observations, we are going to predict 'y. According to 0.05 significant level, present stepwise regression and find the value of R square Variables SSR (regression sum of squares) 1500 SSE (error sum of squares) 1000 X X₂, X2 xz, xz X2, X₃ X2, X2, X3 SST (total sum of squares) 2500 2500 2500 2500 2500 2500 2500 2500 1400 1300 1300 2250 2400 2435 2450 1100 1200 250 100 65 50
The following Regression function has been developed to check the relationship between the dependent variable y...
 The following Regression function has been developed to check
the relationship between the dependent variable y and the
independent variable ?1 .
Consider the following Minitab output and answer the
questions.
Regression Equation
?̂ = ? . ? ? + ? . ? ? x1
a) Please fill out the Coefficients table appropriately.
b) Please fill out the ANOVA table appropriately.
c) Suppose that variables ?2 ??? ?3 are added to the above model
and the following regression analysis is...
The following Regression function has been developed to check
the relationship between the dependent variable y and the
independent variable ?1 .
Consider the following Minitab output and answer the
questions.
Regression Equation
?̂ = ? . ? ? + ? . ? ? x1
a) Please fill out the Coefficients table appropriately.
b) Please fill out the ANOVA table appropriately.
c) Suppose that variables ?2 ??? ?3 are added to the above model
and the following regression analysis is...
 4. Testing for significance Aa Aa Consider a multiple regression model of the dependent variable y on independent variables x1, x2, X3, and x4: Using data with n = 60 observations for each of the variables, a student obtains the following estimated regression equation for the model given: 0.04 + 0.28X1 + 0.84X2-0.06x3 + 0.14x4 y She would like to conduct significance tests for a multiple regression relationship. She uses the F test to determine whether a significant relationship exists...
 Additional Problem A researcher collected data on Y and four X-variables: X1, X2, X3, X4, and he wants to obtain a regression model. However, he is not sure if all the four X-variables should be included in the model. He provides you with the information shown below, namely, the SSR obtained when Y was regressed on each subset of X-variables. Also given: SST-100, and that the sample size is n 12. Your task Apply the Forward-Stepwise selection method, with a-to-enter-...
 Consider a multiple regression model of the dependent variable y on independent variables x1, x2, and x3: Using data with n = 12 observations for each of the variables, a researcher obtains the following estimated regression equation for the above model y0.5216 + 1.2419x1 + 0.3049x2 - 0.0217x3 The standard error of estimate for this equation is s0.6489 The table below gives the values for the independent and dependent variables and their corresponding predicted values, residuals, and leverage Predicted Value...
 Using 3 variables and 13 observations, we are going to predict 'y. According to 0.05 significant level, present stepwise regression and find the value of R square Variables SSR (regression sum of squares) 1500 SSE (error sum of squares) 1000 X X₂, X2 xz, xz X2, X₃ X2, X2, X3 SST (total sum of squares) 2500 2500 2500 2500 2500 2500 2500 2500 1400 1300 1300 2250 2400 2435 2450 1100 1200 250 100 65 50
 The following Regression function has been developed to check
the relationship between the dependent variable y and the
independent variable ?1 .
Consider the following Minitab output and answer the
questions.
Regression Equation
?̂ = ? . ? ? + ? . ? ? x1
a) Please fill out the Coefficients table appropriately.
b) Please fill out the ANOVA table appropriately.
c) Suppose that variables ?2 ??? ?3 are added to the above model
and the following regression analysis is...
The following Regression function has been developed to check
the relationship between the dependent variable y and the
independent variable ?1 .
Consider the following Minitab output and answer the
questions.
Regression Equation
?̂ = ? . ? ? + ? . ? ? x1
a) Please fill out the Coefficients table appropriately.
b) Please fill out the ANOVA table appropriately.
c) Suppose that variables ?2 ??? ?3 are added to the above model
and the following regression analysis is...
Most questions answered within 3 hours.
-
When you borrow money to buy a house, a car, or for some other
purpose, you...
asked 4 minutes ago -
Write a c program that finds the uncommon elements from two
array elements using pointers
only...
asked 10 minutes ago -
SQL help:
Design a database diagram for a database that stores information
about the Downloads that...
asked 1 hour ago -
In 1970s and 1980s, molecular biologists discovered that the
hormone testosterone, binds a receptor protein that...
asked 3 hours ago -
january 1 2010 road catering service purchase a piece of
equipment for 58000 which is expected...
asked 3 hours ago -
Explain Mertons concept of anomie is and what the
modes of adaptation to it are?
asked 4 hours ago -
Jamie is doing a survey at her school about whether the students
feel the cafeteria food...
asked 6 hours ago -
How many liters of 0.669 M KOH will be needed to raise the pH of
0.339...
asked 8 hours ago -
A liquid of density 1270 kg/m 3 flows steadily through a pipe of
varying diameter and...
asked 8 hours ago -
Questions: What should the American executive do?
'A visiting American executive finds that a foreign subsidiary...
asked 8 hours ago -
Activity based costing was introduced as an alternative to
absorption costing.
1. Discuss using illustration the...
asked 8 hours ago -
1. You own shares of Crane DVD Company and are interested in
selling them. With so...
asked 8 hours ago