***PLEASE DO ALL THIS IS MY LAST QUESTION OF THE GIVEN AMOUNT OF QUESTIONS :( ***
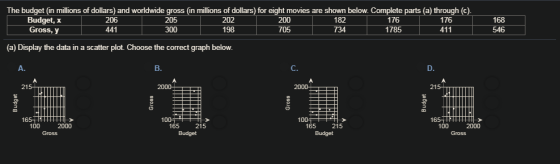


The budget (in millions of dollars) and worldwide gross (in millions of dollars) for eight movies are shown below. Complete parts (a) through (c) 176 1785 176 411 168 546 Budget, x Gross, y 206 441 205 300 200 705 182 198 (a) Display the data in a scatter plot. Choose the correct graph below A. B. C. 21 1651 165 100 165 215 165 215 100
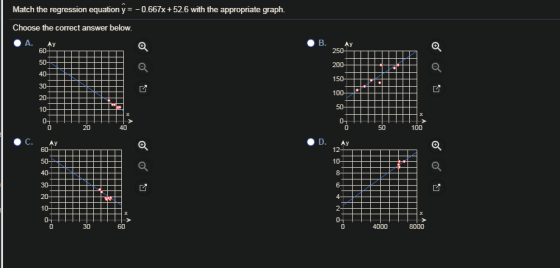
Match the regression equation y-0.667x+52.6 with the appropriate graph. Choose the correct answer below. Ay 12- 4000 0 8000 0 50 100 C. Ay 0 20 40 0 30 60
Match the regression equation y 0.667x+52.6 with the appropriate graph. Choose the correct answer below. B. 0 20 40 0 50 100 D. Ay 0 30 60 0 4000 8000
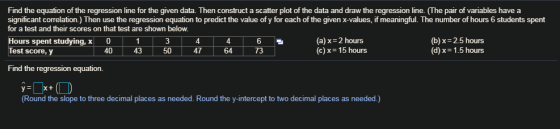
Find the equation of the regression line for the given data. Then construct a scatter plot of the data and draw the regression line. (The pair of variables have a signific ant correlation.) Then use the regression equation to predict the value of y for each of the given x-values, if meaningful. The number of hours 6 students spent for a test and their scores on that test are shown below. (a) x 2 hours (c)x-15 hours Hours spent studying, x0 Test score, y 1 3 446 (b)x-2.5 hours (d)x=1.5 hours 40 43 50 47 64 73 Find the regression equation. Round the slope to three decimal places as needed. Round the y-intercept to two decimal places as needed.)
Use the value of the linear correlation coefficient to calculate the coefficient of determination. What does this tell you about the explained variation of the data about the regression line? About the unexplained variation? r0.652 Calculate the coefficient of detemination. (Round to three decimal places as needed.)
Use the value of the linear correlation coefficient to calculate the coefficient of determination. What does this tell you about the explained variation of the data about the regression line? About the unexplained variation? r0.831 Calculate the coefficient of determination. Round to three decimal places as needed.)
Homework Answers
1)
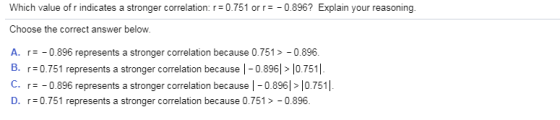
stronger correlation
option C) is correct
2)
option C) is correct scatter plot
3)
y^= -0.667 x + 52.6
option D) is correct
4)
this is same as Q3
option C) is correct
5)
Y^= 5.167 x + 37.333
6)
r^2 = 0.425
7)
r^2 = 0.691
Add Answer to:
***PLEASE DO ALL THIS IS MY LAST QUESTION OF THE GIVEN AMOUNT OF QUESTIONS :( *** Which value of r indicates a stronger correlation:r 0.751 orr0.896? Explain your reasoning Choose the correct answer...
Find the margin of error for the given values of c, s, and n. c 0.90,...
 Find the margin of error for the given values of c, s, and n. c 0.90, s-2.7, n 29 Click the icon to view the t-distribution table. The margin of error is . (Round to one decimal place as needed.) Which value of r indicates a stronger correlation: 0.846 or0.933? Explain your reasoning. Choose the correct answer below A. r=-0.933 represents a stronger correlation because l-0.939 > 10.845. B. r0.846 represents a stronger correlation because 0.846> -0.933. C.-0.933 represents a...
Please show all work AND any calculator functions. The table below summarizes data of heights and...
Please show all work AND any calculator functions. The table below summarizes data of heights and weights of 8 randomly selected adults. Use this information to answer parts a) – h). Height (x) in inches 5.2 5.6 5.8 5.9 5.4 6.1 6.0 5.7 Weight (y) in pounds 119 136 155 185 135 202 194 165 a) Test the claim ρ ≠ 0. Use α = 0.01. • State the hypotheses and label the claim. • State the significance level (α)....
The table shows the number of goals allowed and the total points earned (2 points for...
 The table shows the number of goals allowed and the total points earned (2 points for a win, and 1 point for an overtime or shoc season. The equation of the regression line is y = -0.600x + 225.826. Use the data to answer the following questions. (a) Find the coefficient of determination, and interpret the result. (b) Find the standard error of the estimate, se, and interpret the result. Goals 212 210 219 223 259 258 273 200 217...
Find the equation of the regression line for the given data. Then construct a scatter plot...
 Find the equation of the regression line for the given data. Then construct a scatter plot of the data and draw the regression line. (The pair of variables have a significant correlation.) Then use the regression equation to predict the value of y for each of the given x-values, if meaningful. The number of hours 6 students spent for a test and their scores on that test are shown below. Hours spent studying, X 2 5 5 (a) x =...
1. Choose the correct answer from the choices given. (2 points) a. Select the most likely...
 1. Choose the correct answer from the choices given. (2 points) a. Select the most likely answer for the coefficient of linear correlation for the two the number of hours spent studying for a test y = the number of points earned on the test variables described below: x= r= 1.20 B. r 0.70 C. r= -0.85 D. r= 0.05 1. Choose the correct answer from the choices given. (2 points) a. Select the most likely answer for the coefficient...
BBA 403 TEST 3: Name: Score:_ SOLVE AND THOROUGHLY INTERPRET YOUR ANSWER 1. A marketing manager conducted a study to determine whether there is a linear relationship between many spent on adverti...
 BBA 403 TEST 3: Name: Score:_ SOLVE AND THOROUGHLY INTERPRET YOUR ANSWER 1. A marketing manager conducted a study to determine whether there is a linear relationship between many spent on advertising and company sales. The data are shown on the table below. Display the data in a scatter plot, calculate the correlation coefficient, state a conclusion, and interpret the result Adverstising Company Expense, (1000s of s) (1000s of ) 2.4 16 2.0 26 14 1.6 2.0 2.2 184 220...
Last two photos are responses to choose for questions #1$#4 Bivariate data obtained for the paired...
 Last two photos are responses to choose for questions
#1$#4
Bivariate data obtained for the paired variables x and y are shown below, in the table labelled "Sample data." These data are plotted in tho scatter plot in Figure 1, which also displays the least-squares regression line for the data. The equation for this line is y25.35+1.10x In the "Calculations" table are calculations involving the observed y values, the mean y of these values, and the values y predicted from...
Last two photos are responses to choose for questions
#1$#4
Bivariate data obtained for the paired variables x and y are shown below, in the table labelled "Sample data." These data are plotted in tho scatter plot in Figure 1, which also displays the least-squares regression line for the data. The equation for this line is y25.35+1.10x In the "Calculations" table are calculations involving the observed y values, the mean y of these values, and the values y predicted from...
Can you please answers these four questions as aoin as possible please and thank you! Given...
 Can you please answers these four questions as aoin as
possible please and thank you!
Given are five observations for two variables, z and y 5 13 20 18 48 57 11 27 a. Choose the corre rect scatter diagram for these data: A. B. 60+ 60 50 50 40 40 30+ 30 20 20 10 10- 10 20 30 40 50 60 x 10 20 30 40 50 60 57 x y 60 60 50+ 50- 40- 40+ 30-...
Can you please answers these four questions as aoin as
possible please and thank you!
Given are five observations for two variables, z and y 5 13 20 18 48 57 11 27 a. Choose the corre rect scatter diagram for these data: A. B. 60+ 60 50 50 40 40 30+ 30 20 20 10 10- 10 20 30 40 50 60 x 10 20 30 40 50 60 57 x y 60 60 50+ 50- 40- 40+ 30-...
can someone help me with this i am stuck with all these questions i dont get...
 can someone help me with this i am stuck with all these
questions i dont get it
Here are summary statistics for randomly selected weights of newborn girts: n = 155, X = 33.6 hg, 8 = 6.5 hg. Construct a confidence interval estimate of the mean. Use a 99% confidence level. Are these results very different from the confidence interval 31.3 hg <u <35.1 hg with only 13 sample values, x = 33.2 hg, and s = 2.3 hg?...
can someone help me with this i am stuck with all these
questions i dont get it
Here are summary statistics for randomly selected weights of newborn girts: n = 155, X = 33.6 hg, 8 = 6.5 hg. Construct a confidence interval estimate of the mean. Use a 99% confidence level. Are these results very different from the confidence interval 31.3 hg <u <35.1 hg with only 13 sample values, x = 33.2 hg, and s = 2.3 hg?...
Please help with multi step question- 1 question with 6 parts!! The table below gives the...
 Please help with multi step question- 1 question with 6
parts!!
The table below gives the number of hours seven randomly selected students spent studying and their corresponding midterm exam grades. Using this data, consider the equation of the regression line, y bo + bix, for predicting the midterm exam grade that a student will earn based on the number of hours spent studying. Keep in mind, the correlation coefficient may or may not be statistically significant for the data...
Please help with multi step question- 1 question with 6
parts!!
The table below gives the number of hours seven randomly selected students spent studying and their corresponding midterm exam grades. Using this data, consider the equation of the regression line, y bo + bix, for predicting the midterm exam grade that a student will earn based on the number of hours spent studying. Keep in mind, the correlation coefficient may or may not be statistically significant for the data...
 Find the margin of error for the given values of c, s, and n. c 0.90, s-2.7, n 29 Click the icon to view the t-distribution table. The margin of error is . (Round to one decimal place as needed.) Which value of r indicates a stronger correlation: 0.846 or0.933? Explain your reasoning. Choose the correct answer below A. r=-0.933 represents a stronger correlation because l-0.939 > 10.845. B. r0.846 represents a stronger correlation because 0.846> -0.933. C.-0.933 represents a...
 The table shows the number of goals allowed and the total points earned (2 points for a win, and 1 point for an overtime or shoc season. The equation of the regression line is y = -0.600x + 225.826. Use the data to answer the following questions. (a) Find the coefficient of determination, and interpret the result. (b) Find the standard error of the estimate, se, and interpret the result. Goals 212 210 219 223 259 258 273 200 217...
 Find the equation of the regression line for the given data. Then construct a scatter plot of the data and draw the regression line. (The pair of variables have a significant correlation.) Then use the regression equation to predict the value of y for each of the given x-values, if meaningful. The number of hours 6 students spent for a test and their scores on that test are shown below. Hours spent studying, X 2 5 5 (a) x =...
 1. Choose the correct answer from the choices given. (2 points) a. Select the most likely answer for the coefficient of linear correlation for the two the number of hours spent studying for a test y = the number of points earned on the test variables described below: x= r= 1.20 B. r 0.70 C. r= -0.85 D. r= 0.05 1. Choose the correct answer from the choices given. (2 points) a. Select the most likely answer for the coefficient...
 BBA 403 TEST 3: Name: Score:_ SOLVE AND THOROUGHLY INTERPRET YOUR ANSWER 1. A marketing manager conducted a study to determine whether there is a linear relationship between many spent on advertising and company sales. The data are shown on the table below. Display the data in a scatter plot, calculate the correlation coefficient, state a conclusion, and interpret the result Adverstising Company Expense, (1000s of s) (1000s of ) 2.4 16 2.0 26 14 1.6 2.0 2.2 184 220...
 Last two photos are responses to choose for questions
#1$#4
Bivariate data obtained for the paired variables x and y are shown below, in the table labelled "Sample data." These data are plotted in tho scatter plot in Figure 1, which also displays the least-squares regression line for the data. The equation for this line is y25.35+1.10x In the "Calculations" table are calculations involving the observed y values, the mean y of these values, and the values y predicted from...
Last two photos are responses to choose for questions
#1$#4
Bivariate data obtained for the paired variables x and y are shown below, in the table labelled "Sample data." These data are plotted in tho scatter plot in Figure 1, which also displays the least-squares regression line for the data. The equation for this line is y25.35+1.10x In the "Calculations" table are calculations involving the observed y values, the mean y of these values, and the values y predicted from...
 Can you please answers these four questions as aoin as
possible please and thank you!
Given are five observations for two variables, z and y 5 13 20 18 48 57 11 27 a. Choose the corre rect scatter diagram for these data: A. B. 60+ 60 50 50 40 40 30+ 30 20 20 10 10- 10 20 30 40 50 60 x 10 20 30 40 50 60 57 x y 60 60 50+ 50- 40- 40+ 30-...
Can you please answers these four questions as aoin as
possible please and thank you!
Given are five observations for two variables, z and y 5 13 20 18 48 57 11 27 a. Choose the corre rect scatter diagram for these data: A. B. 60+ 60 50 50 40 40 30+ 30 20 20 10 10- 10 20 30 40 50 60 x 10 20 30 40 50 60 57 x y 60 60 50+ 50- 40- 40+ 30-...
 can someone help me with this i am stuck with all these
questions i dont get it
Here are summary statistics for randomly selected weights of newborn girts: n = 155, X = 33.6 hg, 8 = 6.5 hg. Construct a confidence interval estimate of the mean. Use a 99% confidence level. Are these results very different from the confidence interval 31.3 hg <u <35.1 hg with only 13 sample values, x = 33.2 hg, and s = 2.3 hg?...
can someone help me with this i am stuck with all these
questions i dont get it
Here are summary statistics for randomly selected weights of newborn girts: n = 155, X = 33.6 hg, 8 = 6.5 hg. Construct a confidence interval estimate of the mean. Use a 99% confidence level. Are these results very different from the confidence interval 31.3 hg <u <35.1 hg with only 13 sample values, x = 33.2 hg, and s = 2.3 hg?...
 Please help with multi step question- 1 question with 6
parts!!
The table below gives the number of hours seven randomly selected students spent studying and their corresponding midterm exam grades. Using this data, consider the equation of the regression line, y bo + bix, for predicting the midterm exam grade that a student will earn based on the number of hours spent studying. Keep in mind, the correlation coefficient may or may not be statistically significant for the data...
Please help with multi step question- 1 question with 6
parts!!
The table below gives the number of hours seven randomly selected students spent studying and their corresponding midterm exam grades. Using this data, consider the equation of the regression line, y bo + bix, for predicting the midterm exam grade that a student will earn based on the number of hours spent studying. Keep in mind, the correlation coefficient may or may not be statistically significant for the data...
Most questions answered within 3 hours.
-
284 mL of a 0.52 M potassium hydroxide solution is added to 467
mL of a...
asked 20 minutes ago -
exercise on VSEPR and molecular structrue.
octahedral
SeCl62-
TeCl62-
ClF62-
distorted
SeF62–
IF6–
asked 21 minutes ago -
Little’s Law: Val d’Costa is a world famous ski village in the
French Alps. Because of...
asked 1 hour ago -
Find the absolute error D for the calculation if A + B/C=D A=
9.4 +/- 0.4...
asked 1 hour ago -
New Air Heating and Cooling, manufactures furnaces and central
air units. The company pride itself on...
asked 1 hour ago -
A coach uses a new technique to train gymnasts. Seven
gymnasts were randomly selected and their...
asked 3 hours ago -
While rotating the tires on your car you notice a rock [mass =
0.1 Kg] stuck...
asked 5 hours ago -
Using MARS simulator, write MIPS programs according to
the following scenarios: Receive a positive integer number...
asked 7 hours ago -
An object in front of a concave mirror has a real image that is
11.5 cm...
asked 7 hours ago -
Consider the reaction, C3 H8 + O2 --> CO2 + H2O. How many
moles of O2...
asked 9 hours ago -
You and your opponent both roll a fair die. If you both roll the
same number,...
asked 9 hours ago -
In a study of the accuracy of fast food drive-through orders,
Restaurant A had 257 accurate...
asked 9 hours ago