
Homework Answers
1)
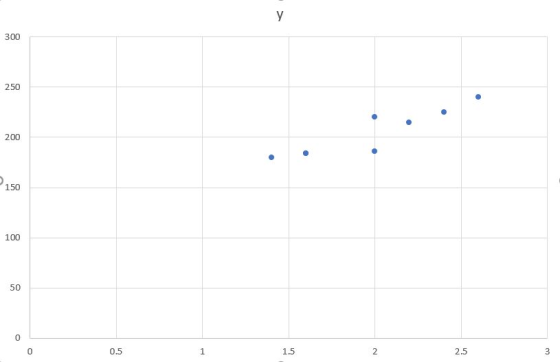
R = 0.9129
there is strong and positive correlation between two variables
2)
| SUMMARY OUTPUT | |||||
| Regression Statistics | |||||
| Multiple R | 0.9129 | ||||
| R Square | 0.8334 | ||||
| Adjusted R Square | 0.8056 | ||||
| Standard Error | 10.2903 | ||||
| Observations | 8 | ||||
| ANOVA | |||||
| df | SS | MS | F | Significance F | |
| Regression | 1 | 3178.1559 | 3178.1559 | 30.0136 | 0.0015 |
| Residual | 6 | 635.3441 | 105.8907 | ||
| Total | 7 | 3813.5000 | |||
| Coefficients | Standard Error | t Stat | P-value | Lower 95% | |
| Intercept | 104.0607 | 18.6462 | 5.5808 | 0.0014 | 58.4351 |
| x | 50.7287 | 9.2597 | 5.4785 | 0.0015 | 28.0712 |


df = 6
critical value = =t.inv.2t(0.05,6) = 2.4469
rejection region
|TS| > 2.4469
TS = 5.4785
p-value = 0.0015
since p-value < alpha
we reject the null hypothesis
we conclude that correlation is significant
3)
x = 1.8
y^ = 104.0607 + 50.7287*x
= 104.0607 + 50.7287*1.8
= 195.3724
4)
r^2 = 0.8334
which means 83.34 % of variation in y is explained by this model
Add Answer to:
BBA 403 TEST 3: Name: Score:_ SOLVE AND THOROUGHLY INTERPRET YOUR ANSWER 1. A marketing manager conducted a study to determine whether there is a linear relationship between many spent on adverti...
6 A market manager condacted a study to determine whether there is a linear relatioreship betwecn money spent and advertising and company sales. Determine if there is a linear correlation or not....
 6 A market manager condacted a study to determine whether there is a linear relatioreship betwecn money spent and advertising and company sales. Determine if there is a linear correlation or not. Uise a-0.05 Advertising Expnscs 24 1.6 2.0 2.6 14 16 20 22 Company184 Sales 225 184 220 240 180 184 186 215 (Each one times $1000) Find: a) The correlation coefficient r b) In your opinion, is there a strong linear correlation? Weak lincar correlation? Explain c) What...
What is the relationship between the amount of time statistics students study per week and their...
What is the relationship between the amount of time statistics students study per week and their final exam scores? The results of the survey are shown below. Time 12 0 3 14 14 9 0 13 10 Score 95 60 73 85 86 89 65 97 93 Find the correlation coefficient: r=r= Round to 2 decimal places. The null and alternative hypotheses for correlation are: H0:H0: ? μ ρ r == 0 H1:H1: ? ρ μ r ≠≠ 0 The p-value is: (Round...
The length of time in yours took a random sample of 32 forkers to quit smoking...
 The length of time in yours took a random sample of 32 forkers to quit smoking permanentyrested in the population standard deviation is 630.00, is there enough evidence to the claim that the man time to smokers to gut smoking permanenty i 13 yos? Complete parts) 127 87 104 123 103 174 117 22.10 165 159 204 16.5 144 174 15.1 162 223 10.7 17.5 16.7 107 224 32 156 112184 11.1 1 197 2211553 (a) Identity the chain and...
DIRECTIONS: Make sure your responses are neat and readable. You must show me your calculation in...
 DIRECTIONS: Make sure your responses are neat and readable. You must show me your calculation in a separate piece of paper. Homework that is difficult to grade due to messiness will be returned ungraded. If you would like to get full credit, do not forget to attach the Excel output. The number of hours 10 students spent studying for a test and their scores on that test is represented in the table below. 0 2 4 5 5 Hours spent...
A food murer moting is now cereales part of a daily diellowers total blood cholesterol levels....
 A food murer moting is now cereales part of a daily diellowers total blood cholesterol levels. The table shows the olood cholesterol levels in miligrams per deciliter of blood of seven patients before eating the coreland hoone year of singers as part of the disse toch oost the meanino Assume the samples are random and dependent and the population is nostrud. Al 0.05, can you conclude that we lowers total blood cholesterol level? Patient Total Blood Cholesterol forel 215 Total...
1. Suppose you are interested in buying a new Lincoln Navigator or Town Car. You are...
1. Suppose you are interested in buying a new Lincoln Navigator or Town Car. You are standing on the sales lot looking at a model with different options. The list price is on the vehicle. As a salesperson approaches, you wonder what the dealer invoice price is for this model with its options. The following data are based on a random selection of these cars of different models and options. Let y be the dealer invoice (in thousands of dollars)...
 6 A market manager condacted a study to determine whether there is a linear relatioreship betwecn money spent and advertising and company sales. Determine if there is a linear correlation or not. Uise a-0.05 Advertising Expnscs 24 1.6 2.0 2.6 14 16 20 22 Company184 Sales 225 184 220 240 180 184 186 215 (Each one times $1000) Find: a) The correlation coefficient r b) In your opinion, is there a strong linear correlation? Weak lincar correlation? Explain c) What...
 The length of time in yours took a random sample of 32 forkers to quit smoking permanentyrested in the population standard deviation is 630.00, is there enough evidence to the claim that the man time to smokers to gut smoking permanenty i 13 yos? Complete parts) 127 87 104 123 103 174 117 22.10 165 159 204 16.5 144 174 15.1 162 223 10.7 17.5 16.7 107 224 32 156 112184 11.1 1 197 2211553 (a) Identity the chain and...
 DIRECTIONS: Make sure your responses are neat and readable. You must show me your calculation in a separate piece of paper. Homework that is difficult to grade due to messiness will be returned ungraded. If you would like to get full credit, do not forget to attach the Excel output. The number of hours 10 students spent studying for a test and their scores on that test is represented in the table below. 0 2 4 5 5 Hours spent...
 A food murer moting is now cereales part of a daily diellowers total blood cholesterol levels. The table shows the olood cholesterol levels in miligrams per deciliter of blood of seven patients before eating the coreland hoone year of singers as part of the disse toch oost the meanino Assume the samples are random and dependent and the population is nostrud. Al 0.05, can you conclude that we lowers total blood cholesterol level? Patient Total Blood Cholesterol forel 215 Total...
Most questions answered within 3 hours.
-
Consider the competitive environment of Starbuck's, Progressive
Insurance, a manufacturing firm with low turnover, or a...
asked 32 minutes ago -
3. Gains from trade
Consider two neighbouring island countries called Euphoria and
Contente. They each have...
asked 2 hours ago -
A business executive has the option to invest money in two
plans: Plan A guarantees that...
asked 4 hours ago -
Hello, can someone please help me answer this question?
How much heat is absorbed by a...
asked 4 hours ago -
. A marketing researcher conducted a survey of 25 shoppers
randomly selected at the local mall...
asked 5 hours ago -
Create an comprehensive response to the
following:
Antimicrobial agents work on a multitude of microbes (bacteria,...
asked 5 hours ago -
6.13 LAB: Step counter. Section 6.3.
A pedometer treats walking 2,000 steps as walking 1 mile....
asked 4 hours ago -
(14.2) A block of mass m = 10 kg riding on a frictionless
horizontal plane is...
asked 5 hours ago -
Use any search engine to search for articles about Starbucks
partnership with Tata Companies in India...
asked 5 hours ago -
Let’s say that for some reason Bank Excess Reserves suddenly
increase sharply. What effect would this...
asked 5 hours ago -
Given:
Curent Assets: $600,000
Total Assets: $2,600,000
Current Liabilities: $500,000
Total Liabilities: $1,700,000
What is the...
asked 5 hours ago -
1. What is a “Bankster”? What is insider trading? Why is it
illegal?
2. What is...
asked 5 hours ago