

Homework Answers
(1)
Following is the scatter plot:

Scatter plot shows a strong, positive and linear relationship between the variables.
(2)
Following table shows the calculations:
| X | Y | X^2 | Y^2 | XY | |
| 0 | 40 | 0 | 1600 | 0 | |
| 2 | 51 | 4 | 2601 | 102 | |
| 4 | 64 | 16 | 4096 | 256 | |
| 5 | 69 | 25 | 4761 | 345 | |
| 5 | 73 | 25 | 5329 | 365 | |
| 5 | 75 | 25 | 5625 | 375 | |
| 6 | 93 | 36 | 8649 | 558 | |
| 7 | 90 | 49 | 8100 | 630 | |
| 8 | 95 | 64 | 9025 | 760 | |
| 9 | 95 | 81 | 9025 | 855 | |
| Total | 51 | 745 | 325 | 58811 | 4246 |

(3)
The correlation coefficient is positive. It has magnitude 0.964. It shows a very strong, linear and positive relationship between the variables.
(4)

(5)
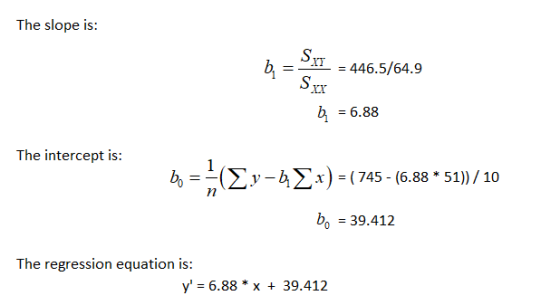
Slope: It shows that for each unit increase in hours spent studying test scores is increased by 6.880.
Intercept: When studying hours are zero test score will be 39.412.
(6)
(7)

It shows that 93.9% of variation in test scores is explained by hours of studying.
(8)
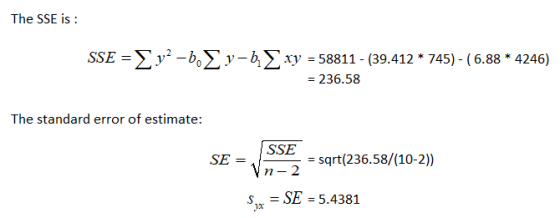
(9)
Yes it seems it is good predictor. Because r-square is high, SE is small. Test shows that there is a significant relationship between the variables.
----------------------------------------------------------------
As you need excel output, following is the output generated by excel:
| SUMMARY OUTPUT | ||||||
| Regression Statistics | ||||||
| Multiple R | 0.963570611 | |||||
| R Square | 0.928468322 | |||||
| Adjusted R Square | 0.919526862 | |||||
| Standard Error | 5.439009075 | |||||
| Observations | 10 | |||||
| ANOVA | ||||||
| df | SS | MS | F | Significance F | ||
| Regression | 1 | 3071.837442 | 3071.837442 | 103.8385614 | 7.37348E-06 | |
| Residual | 8 | 236.6625578 | 29.58281972 | |||
| Total | 9 | 3308.5 | ||||
| Coefficients | Standard Error | t Stat | P-value | Lower 95% | Upper 95% | |
| Intercept | 39.41294299 | 3.848922049 | 10.23999512 | 7.10882E-06 | 30.53731284 | 48.28857314 |
| X | 6.8798151 | 0.67514559 | 10.19012077 | 7.37348E-06 | 5.32292658 | 8.436703621 |
Add Answer to:
DIRECTIONS: Make sure your responses are neat and readable. You must show me your calculation in...
What is the relationship between the amount of time statistics students study per week and their...
What is the relationship between the amount of time statistics students study per week and their test scores? The results of the survey are shown below. Time 16 14 15 6 14 15 6 Score 100 89 100 68 99 100 78 x-values y-values Find the correlation coefficient: r=r= Round to 2 decimal places. The null and alternative hypotheses for correlation are: H0:H0: ? ρ r μ == 0 H1:H1: ? μ r ρ ≠≠ 0 The p-value is: (Round to four decimal...
What is the relationship between the amount of time statistics students study per week and their...
What is the relationship between the amount of time statistics students study per week and their test scores? The results of the survey are shown below. Time 13 10 9 9 2 10 12 8 Score 84 83 90 76 74 86 99 85 x-values y-values Find the correlation coefficient: r=r= Round to 2 decimal places. The null and alternative hypotheses for correlation are: H0:H0: ? r ρ μ == 0 H1:H1: ? μ ρ r ≠≠ 0 The p-value is: (Round to...
What is the relationship between the amount of time statistics students study per week and their...
What is the relationship between the amount of time statistics students study per week and their final exam scores? The results of the survey are shown below. Time 12 0 3 14 14 9 0 13 10 Score 95 60 73 85 86 89 65 97 93 Find the correlation coefficient: r=r= Round to 2 decimal places. The null and alternative hypotheses for correlation are: H0:H0: ? μ ρ r == 0 H1:H1: ? ρ μ r ≠≠ 0 The p-value is: (Round...
9. The data below are the hours spent studying and the corresponding test score earned. Assume...
 9. The data below are the hours spent studying and the corresponding test score earned. Assume that the variables x and y have a significant correlation. Hours spent studying, x 0 2 4 5 5 5 6 7 8 Test score, y 4051 64 69 73 75 9390 95 a) Sketch a scatter plot of the data on provided graph paper segment. (2 pts) b) Describe the type of correlation you see if one exists. (1 pts) c) Find the...
Show all your work as needed for full credit (20 points each). Use the given information...
 Show all your work as needed for full credit (20 points each). Use the given information to complete the test to determine if there is significant linear correlation between numbers of hours a student spent preparing for a test and test scores. Use a significance level of 0.05. 1) 4 1) The test scores of 6 randomly picked students and the numbers of hours they prepared are as follows: Hours 5 10 6 10 9 Score 64 86 69 86...
What is the relationship between the amount of time statistics students study per week and their...
 What is the relationship between the amount of time statistics students study per week and their final exam scores? The results of the survey are shown below. Time Score 3 67 13 95 6 15 77 89 13 100 3 66 7 63 11 79 1 59 a. Find the correlation coefficient: r = Round to 2 decimal places. b. The null and alternative hypotheses for correlation are: Ho: ? D = 0 H: ? *0 The p-value is: (Round...
What is the relationship between the amount of time statistics students study per week and their...
 What is the relationship between the amount of time statistics students study per week and their final exam scores? The results of the survey are shown below. Time Score 3 10 15 512 015 58 75 89 89 77 79 54 96 a. Find the correlation coefficient: r = Round to 2 decimal places. b. The null and alternative hypotheses for correlation are: Ho: ? - 0 H: 70 (Round to four The p-value is: decimal places) c. Use a...
BBA 403 TEST 3: Name: Score:_ SOLVE AND THOROUGHLY INTERPRET YOUR ANSWER 1. A marketing manager conducted a study to determine whether there is a linear relationship between many spent on adverti...
 BBA 403 TEST 3: Name: Score:_ SOLVE AND THOROUGHLY INTERPRET YOUR ANSWER 1. A marketing manager conducted a study to determine whether there is a linear relationship between many spent on advertising and company sales. The data are shown on the table below. Display the data in a scatter plot, calculate the correlation coefficient, state a conclusion, and interpret the result Adverstising Company Expense, (1000s of s) (1000s of ) 2.4 16 2.0 26 14 1.6 2.0 2.2 184 220...
Please help me do it. And please tell me the way you do it, thank you:)
 Please help me do it.
And please tell me the way you do it, thank you:)
3. Eight students were sampled from a school with their final exam scores, Y, and hours studied, X. Assume the linear regression model is appropriate. hours studied 8 9 5 6 7 10 8 8 exam scores 78 85 65 70 75 90 82 80 2x61, y 625, 483 y,2 49283 , 2xyi-4855 (xi-x)2 17.875 , Oz_y)2 454.875 , (xī_x)(yi-у) 89.375 (a) Write down...
Please help me do it.
And please tell me the way you do it, thank you:)
3. Eight students were sampled from a school with their final exam scores, Y, and hours studied, X. Assume the linear regression model is appropriate. hours studied 8 9 5 6 7 10 8 8 exam scores 78 85 65 70 75 90 82 80 2x61, y 625, 483 y,2 49283 , 2xyi-4855 (xi-x)2 17.875 , Oz_y)2 454.875 , (xī_x)(yi-у) 89.375 (a) Write down...
 9. The data below are the hours spent studying and the corresponding test score earned. Assume that the variables x and y have a significant correlation. Hours spent studying, x 0 2 4 5 5 5 6 7 8 Test score, y 4051 64 69 73 75 9390 95 a) Sketch a scatter plot of the data on provided graph paper segment. (2 pts) b) Describe the type of correlation you see if one exists. (1 pts) c) Find the...
 Show all your work as needed for full credit (20 points each). Use the given information to complete the test to determine if there is significant linear correlation between numbers of hours a student spent preparing for a test and test scores. Use a significance level of 0.05. 1) 4 1) The test scores of 6 randomly picked students and the numbers of hours they prepared are as follows: Hours 5 10 6 10 9 Score 64 86 69 86...
 Show all your work as needed for full credit (20 points each). Use the given information to complete the test to determine if there is significant linear correlation between numbers of hours a student spent preparing for a test and test scores. Use a significance level of 0.05. 1) 4 1) The test scores of 6 randomly picked students and the numbers of hours they prepared are as follows: Hours 5 10 6 10 9 Score 64 86 69 86...
 What is the relationship between the amount of time statistics students study per week and their final exam scores? The results of the survey are shown below. Time Score 3 67 13 95 6 15 77 89 13 100 3 66 7 63 11 79 1 59 a. Find the correlation coefficient: r = Round to 2 decimal places. b. The null and alternative hypotheses for correlation are: Ho: ? D = 0 H: ? *0 The p-value is: (Round...
 What is the relationship between the amount of time statistics students study per week and their final exam scores? The results of the survey are shown below. Time Score 3 10 15 512 015 58 75 89 89 77 79 54 96 a. Find the correlation coefficient: r = Round to 2 decimal places. b. The null and alternative hypotheses for correlation are: Ho: ? - 0 H: 70 (Round to four The p-value is: decimal places) c. Use a...
 BBA 403 TEST 3: Name: Score:_ SOLVE AND THOROUGHLY INTERPRET YOUR ANSWER 1. A marketing manager conducted a study to determine whether there is a linear relationship between many spent on advertising and company sales. The data are shown on the table below. Display the data in a scatter plot, calculate the correlation coefficient, state a conclusion, and interpret the result Adverstising Company Expense, (1000s of s) (1000s of ) 2.4 16 2.0 26 14 1.6 2.0 2.2 184 220...
 Please help me do it.
And please tell me the way you do it, thank you:)
3. Eight students were sampled from a school with their final exam scores, Y, and hours studied, X. Assume the linear regression model is appropriate. hours studied 8 9 5 6 7 10 8 8 exam scores 78 85 65 70 75 90 82 80 2x61, y 625, 483 y,2 49283 , 2xyi-4855 (xi-x)2 17.875 , Oz_y)2 454.875 , (xī_x)(yi-у) 89.375 (a) Write down...
Please help me do it.
And please tell me the way you do it, thank you:)
3. Eight students were sampled from a school with their final exam scores, Y, and hours studied, X. Assume the linear regression model is appropriate. hours studied 8 9 5 6 7 10 8 8 exam scores 78 85 65 70 75 90 82 80 2x61, y 625, 483 y,2 49283 , 2xyi-4855 (xi-x)2 17.875 , Oz_y)2 454.875 , (xī_x)(yi-у) 89.375 (a) Write down...
Most questions answered within 3 hours.
-
Task 2.6 : In this exercise, you will create a script to
echo users, based on...
asked 51 seconds ago -
How are the activators and repressors different in eukaryotes vs
prokaryotes for regulation of gene expression?
asked 2 minutes ago -
The diameter of the Sun is 1.4x 10⁶ kilometers. (1 km
= 3280 ft) What is...
asked 5 minutes ago -
Calculate the value of the translational partition function of
O2 at 300 K for a volume...
asked 21 minutes ago -
Consider the following tasks, times, and predecessors for an
assembly of set top cable converter boxes:...
asked 19 minutes ago -
10.________ is the proportion of variance in the dependent
variable that is accounted for by the...
asked 32 minutes ago -
Find at least three implicit modelling assumptions or other
qualitative factors which are relevant but not...
asked 33 minutes ago -
Write a method that determines the key of the successor of the
root node in a...
asked 47 minutes ago -
Determine the lattice energy (in kJ/mol) of NaF(s),
using the data provided.
Energy to sublime Na(s)...
asked 55 minutes ago -
How do you explain the deviations from Hardy-Weinberg
equilibrium in a population where smoking has effected...
asked 1 hour ago -
As a general rule, testing should be conducted until all bugs
have been detected.
A. True....
asked 1 hour ago -
Just before a referendum on a school budget, a local newspaper
polls
436
voters to predict...
asked 1 hour ago