
Homework Answers
Solution:
Here, we have to use chi square test for goodness of fit.
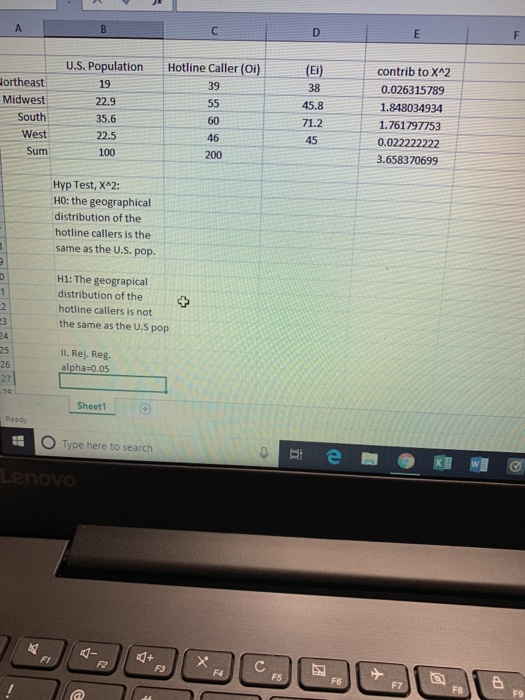
Null hypothesis: H0: The geographical distribution of the hotline callers is the same as the U.S. population.
Alternative hypothesis: Ha: The geographical distribution of the hotline callers is not same as the U.S. population.
We are given level of significance = α = 0.05
Test statistic formula is given as below:
Chi square = ∑[(O – E)^2/E]
Where, O is observed frequencies and E is expected frequencies.
We are given
N = 4
Degrees of freedom = df = N – 1 = 3
α = 0.05
Critical value = 7.814728
(by using Chi square table or excel)
Decision rule: Reject H0 if χ2 > 7.814728
Calculation tables for test statistic are given as below:
|
U.S. Population |
Hotline Caller (O) |
E |
Contribution to Chi square |
|
|
Northeast |
19 |
39 |
38 |
0.026315789 |
|
Midwest |
22.9 |
55 |
45.8 |
1.848034934 |
|
South |
35.6 |
60 |
71.2 |
1.761797753 |
|
West |
22.5 |
46 |
45 |
0.022222222 |
|
Total |
100 |
200 |
200 |
3.658370699 |
Chi square = ∑[(O – E)^2/E] = 3.658370699
P-value = 0.300795291
(By using Chi square table or excel)
P-value > α = 0.05
So, we do not reject the null hypothesis
There is sufficient evidence to conclude that the geographical distribution of the hotline callers is the same as the U.S. population.
Excel formulas for this test is given as below:
|
U.S. Population |
Hotline Caller (O) |
E |
Contribution to Chi square |
|
|
Northeast |
19 |
39 |
=38 |
=(H2-I2)^2/I2 |
|
Midwest |
22.9 |
55 |
45.8 |
=(H3-I3)^2/I3 |
|
South |
35.6 |
60 |
71.2 |
=(H4-I4)^2/I4 |
|
West |
22.5 |
46 |
45 |
=(H5-I5)^2/I5 |
|
Total |
=SUM(G2:G5) |
=SUM(H2:H5) |
=SUM(I2:I5) |
=SUM(J2:J5) |
|
P-value |
=CHIDIST(J6,3) |
|||
|
Critical Value |
=CHIINV(0.05,3) |
Add Answer to:
can someone help me finish this? on excel please. forgot the steps uestion 1. Problem 1 Contrib to X42 Hotline Callers (Oi) U.S. Population 19 22.9 35.8 22.5 Northeast Midwest South West 80 46 To...
Most questions answered within 3 hours.
-
Please Help ASAP.
1Consider the below code which iterates over a linked
list of n nodes...
asked 31 seconds from now -
Determine the air to fuel ratio of:
Canadian natural gas, with 93.9% methane, 4.2% ethane, 0.3%...
asked 1 second from now -
A manufacturer of power tools claims that the average amount of
time required to assemble their...
asked 2 minutes ago -
"electron-withdrawing substituents on carbon encourage back
donation", then on the next page he says that "greater...
asked 13 minutes ago -
On December 31, 2016, the shareholders’ equity section of the
balance sheet of R & L...
asked 21 minutes ago -
16.7
At t=0s a small "upward" (positive y) pulse centered at x = 5.0
m is...
asked 35 minutes ago -
Twitter Users and News: A poll conducted in 2013 found that 52%
of U.S. adult Twitter...
asked 50 minutes ago -
How
would I know whether a given amino acid has an ionizable group or
not? please...
asked 57 minutes ago -
True or false?
True False The function of the enzyme acyl CoA
synthetase is the ATP-dependent coupling...
asked 58 minutes ago -
Nadia Corporation adjusts its debt so that its interest coverage
(EBIT/Interest) remains constant at 3. Nadia’s...
asked 1 hour ago -
In a clinical trial, 20 out of 600 patients taking a
prescription drug complained of flulike...
asked 1 hour ago -
7. How many types of nuclear processes can produce energy? 8.
How many types of radioactive...
asked 1 hour ago