


Homework Answers
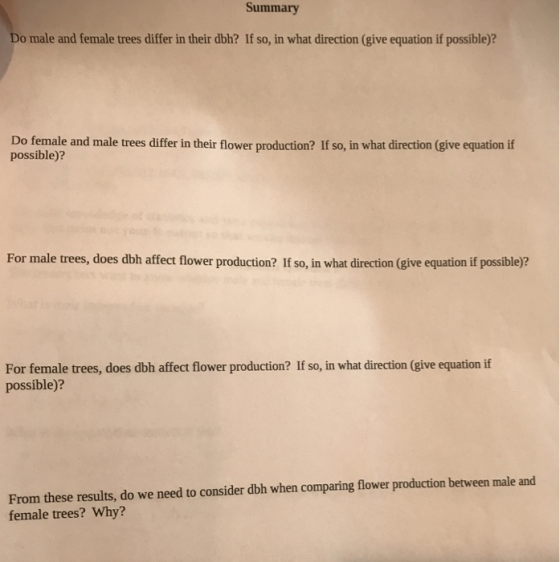
In research question 2 the dependent variable is fl0wer production. The normal population assumption is not confirmed to apply two sample t test. Hence for the first two research question U test (parametric test) is the appropriate one.
In research question 1 the pvalue >0.05 so at 5% significance level the null hypothesis cannot be rejected
Again in research question 2 the p value >0.05 so the same conclusion follows for 5% alpha ie Flower production will not differ for males and females
For research question 3 and 4 you can use correlation test
Research question 3&4)Independent variable in question 3 and 4 is the dbh of male trees and female trees respectively and dependent variable in question 3 and 4 is the flower production of male trees and female trees respectively.
Correlation test tests whether the correlation coefficient is 0
; Null hypothesis 

When variables with the same characteristics are compared eg the breast height for two groups we use t test or u test . t test when assumptions for the t test are met. otherwise we go for u test
When variables with different characteristics are compared ie breast height and flower production a correlation test can be performed. If prediction is made we conduct a regression test.
There is no scope for anova in this question
Answer for the 5th question in the summary (last page) If there exist a significant relationship between dbh and flower production for males and females then we can perform a multiple regression and try to estimate the flower production by keeping gender and dbh as independent variables.
Add Answer to:
how would i know which test i could use. is there a fabke perhaos where i could see which tests i could choose? Anova, t-Test, Regression, Correlation, U-Test,etc.... Mandaue Test Your Ski...
Psy 248: STATISTICS- MARIA MIRANDA Computer Lab Assignment II, SP 2019 Comparing means using t-te...
 Psy 248: STATISTICS- MARIA MIRANDA Computer Lab Assignment II, SP 2019 Comparing means using t-tests This assignment will give you practice choosing the appropriate test statistic to use for different research designs that all involve comparing using t-tests. You will need to enter the data, use SPSS to test hypothesis, and write a conclusion for each problem stating weather or not the samples differed significantly. To run all 3 tests, use: ANALYZE, COMPARE MEANS, and then select the type of...
In what follows use any of the following tests/procedures: Regression, multiple regression, confidence intervals, one sided T-test or two sided T-test. All the procedures should be done with 5% P-valu...
In what follows use any of the following tests/procedures: Regression, multiple regression, confidence intervals, one sided T-test or two sided T-test. All the procedures should be done with 5% P-value or 95% confidence interval.Some answers are approximated, choose the most appropriate answer.Open Brains data. SETUP: Some people believe that the first born children are more intelligent. Given the data your job is to confirm or disprove this assertion. I. What test/procedure did you perform? (6.66 points) a. One sided T-test...
Q2) Independent-Samples t-Test (15 points total) Help with H, I, J, K, L please! In a...
Q2) Independent-Samples t-Test (15 points total) Help with H, I, J, K, L please! In a research project, researchers collected demographic and health data from a sample of elderly residents in the community. To examine any possible gender differences in their sample, they want to see if the females and the males differ significantly on the education level (number of years of formal schooling). The researchers are not predicting any direction in the possible gender differences so the hypotheses should...
Q2) Independent-Samples t-Test (15 points total) In a research project, researchers collected demographic and health data...
Q2) Independent-Samples t-Test (15 points total) In a research project, researchers collected demographic and health data from a sample of elderly residents in the community. To examine any possible gender differences in their sample, they want to see if the females and the males differ significantly on the education level (number of years of formal schooling). The researchers are not predicting any direction in the possible gender differences so the hypotheses should be non-directional. They would like to run a...
The z-tests Help with this page is greatly appreciated. I dont understand how to show a full diagram. Thanks in advance :) The z-test 10.1 Assume that a treatment does have an effect and that th...
 The
z-tests
Help with this page is greatly appreciated. I dont understand
how to show a full diagram. Thanks in advance :)
The z-test 10.1 Assume that a treatment does have an effect and that the treatment effect is being evaluated with a z hypothesis test. If all factors are held constant, how is the outcome of the hypothesis test influenced by sample size? To answer this question, do the following two tests and compare the results. For both tests,...
The
z-tests
Help with this page is greatly appreciated. I dont understand
how to show a full diagram. Thanks in advance :)
The z-test 10.1 Assume that a treatment does have an effect and that the treatment effect is being evaluated with a z hypothesis test. If all factors are held constant, how is the outcome of the hypothesis test influenced by sample size? To answer this question, do the following two tests and compare the results. For both tests,...
 Psy 248: STATISTICS- MARIA MIRANDA Computer Lab Assignment II, SP 2019 Comparing means using t-tests This assignment will give you practice choosing the appropriate test statistic to use for different research designs that all involve comparing using t-tests. You will need to enter the data, use SPSS to test hypothesis, and write a conclusion for each problem stating weather or not the samples differed significantly. To run all 3 tests, use: ANALYZE, COMPARE MEANS, and then select the type of...
 The
z-tests
Help with this page is greatly appreciated. I dont understand
how to show a full diagram. Thanks in advance :)
The z-test 10.1 Assume that a treatment does have an effect and that the treatment effect is being evaluated with a z hypothesis test. If all factors are held constant, how is the outcome of the hypothesis test influenced by sample size? To answer this question, do the following two tests and compare the results. For both tests,...
The
z-tests
Help with this page is greatly appreciated. I dont understand
how to show a full diagram. Thanks in advance :)
The z-test 10.1 Assume that a treatment does have an effect and that the treatment effect is being evaluated with a z hypothesis test. If all factors are held constant, how is the outcome of the hypothesis test influenced by sample size? To answer this question, do the following two tests and compare the results. For both tests,...
Most questions answered within 3 hours.
-
A 8.15- g bullet from a 9-mm pistol has a velocity of 366.0 m/s.
It strikes...
asked 1 hour ago -
The outstanding bonds of Alpha Extracts have a yield to maturity
of 7.4 percent and a...
asked 1 hour ago -
The Problem: The Case of the Harmonizing Vacations
Your CEO is exploring partnering with a European...
asked 2 hours ago -
A chemical equation is balanced by adding coefficients in front
of some formulas so that the...
asked 2 hours ago -
From the literature (reference your sources): What are the
lattice parameters of calcite and aragonite? Why...
asked 3 hours ago -
Your system is rejecting the question am asking which is
preceded by a case study. It...
asked 3 hours ago -
3. On January 2, 2000, Larry creates a trust with himself as
trustee. Larry as trustee...
asked 3 hours ago -
A member of the volleyball team spikes the ball. During this
process, she changes the velocity...
asked 3 hours ago -
Are adult gamers less likely to use a gaming console (Xbox,
PlayStation, Wii, etc...) than teen...
asked 4 hours ago -
The University of
Texas recently reported that 43% of college students aged 18-24
would spend their...
asked 4 hours ago -
The length of stay at a specific emergency department in
Phoenix, Arizona, in 2009 had a...
asked 3 hours ago -
. Please give the mechanism for this type of problem. Step by
Step
The toxin that...
asked 3 hours ago