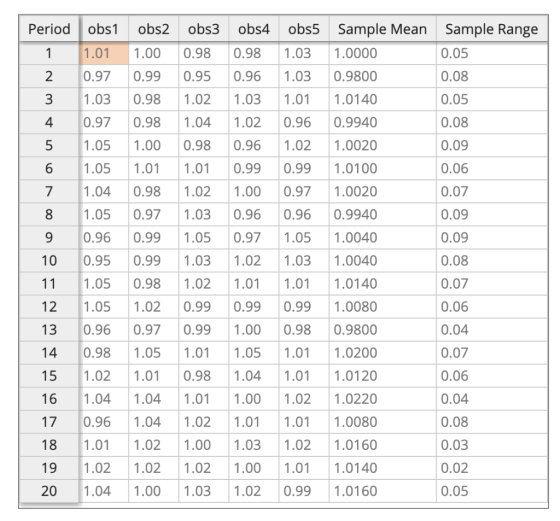
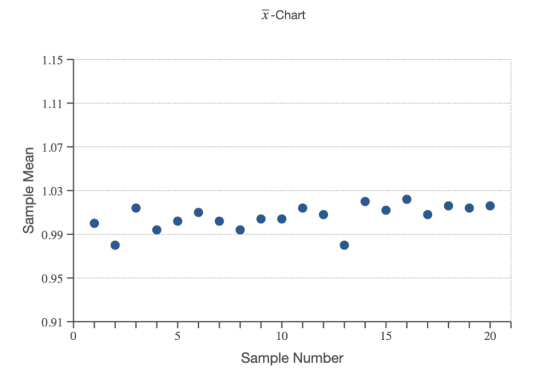
To determine if their 1.00 centimeter washers are properly adjusted, Reeves Inc. has decided to use an x‾-Chart which uses the range to estimate the variability in the sample.
Step 2 of 7 :
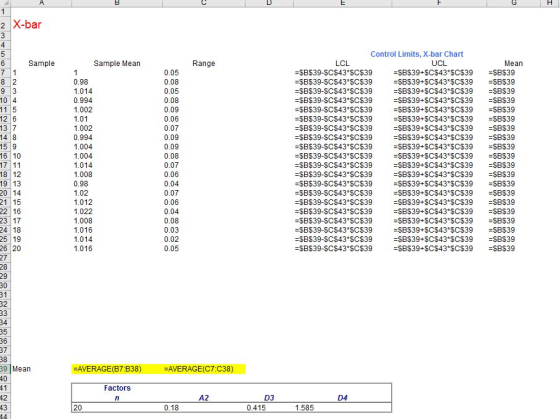
What is the Upper Control Limit? Round your answer to three decimal places.
Homework Answers
What is the Upper Control Limit? Round your answer to three decimal places
1.017

Formula Ref:
Add Answer to:
To determine if their 1.00 centimeter washers are properly adjusted, Reeves Inc. has decided to use an x‾-Chart which uses the range to estimate the variability in the sample. Step 2 of 7 : What is...
Suppose 1000 coins are tossed. Use the normal curve approximation to the binomial distribution to find...
 Suppose 1000 coins are tossed. Use the normal curve approximation to the binomial distribution to find the probability of getting the following result. Exactly 495 heads Use the table of areas under the standard normal curve given below. Click here to view page 1. Click here to view page 2. Click here to view page 3. Click here to view page 4. Click here to view page 5. Click here to view page 6. The probability of getting exactly 495...
Suppose 16 coins are tossed. Use the normal curve approximation to the binomial distribution to find...
 Suppose 16 coins are tossed. Use the normal curve approximation to the binomial distribution to find the probability of getting the following result. More than 11 tails. Use the table of areas under the standard normal curve given below. Click here to view page 1. Click here to view page 2. Click here to view page 3. Click here to view page 4. Click here to view page 5. Click here to view page 6. Binomial probability = (Round to...
 Suppose 1000 coins are tossed. Use the normal curve approximation to the binomial distribution to find the probability of getting the following result. Exactly 495 heads Use the table of areas under the standard normal curve given below. Click here to view page 1. Click here to view page 2. Click here to view page 3. Click here to view page 4. Click here to view page 5. Click here to view page 6. The probability of getting exactly 495...
 Suppose 16 coins are tossed. Use the normal curve approximation to the binomial distribution to find the probability of getting the following result. More than 11 tails. Use the table of areas under the standard normal curve given below. Click here to view page 1. Click here to view page 2. Click here to view page 3. Click here to view page 4. Click here to view page 5. Click here to view page 6. Binomial probability = (Round to...
Most questions answered within 3 hours.
-
A 0.035 mol sample of a weak acid, HA, is dissolved in 437 mL of
water...
asked 1 minute ago -
a sample of Ar gas has a volume of 6.30 L with an unknown
pressure. the...
asked 1 minute ago -
The
serum cholesterol levels of a population of kids follow a normal
distribution with mean 155...
asked 21 minutes ago -
han discusses the racist practice of badlands, a bar
in the Castro
district of San Francisco,...
asked 33 minutes ago -
A sample of final exam scores is normally distributed with a
mean equal to 25 and...
asked 37 minutes ago -
An investor shorts 100 shares of a stock when the share price is
$50 and closes...
asked 41 minutes ago -
LLOP corporation just paid 4$ dividend per share, you expect the
dividend to grow 8% for...
asked 50 minutes ago -
if we subtract 1000 from 0001 is there overflow? (binary)
asked 58 minutes ago -
Hello, I need help with the function below, The language I am
using is Ocaml
open...
asked 59 minutes ago -
Explain how the presence of glucose represses the gal structural
genes?
asked 1 hour ago -
For the reaction CaI2+2AgNO3⟶2AgI+Ca(NO3)2 how many grams of
silver iodide, AgI, are produced from 56.5 g...
asked 1 hour ago -
Write an equation for hydrolysis via acid catalysis.
Using ethyl acetate, ethyl benzoate, ethyl formate or...
asked 1 hour ago