
Homework Answers
Mid point:
| Age | Frequency | midpoint |
| 16 - 19 | 38 | 17.5 |
| 20 - 24 | 36 | 22 |
| 25 - 34 | 24 | 29.5 |
| 35 - 54 | 20 | 44.5 |
| 55 - 74 | 18 | 64.5 |
| 75+ | 28 | 80 |
Formula :
| Age | Frequency | midpoint |
| 16 - 19 | 38 | =(LEFT(A2,2)+RIGHT(A2,2))/2 |
| 20 - 24 | 36 | =(LEFT(A3,2)+RIGHT(A3,2))/2 |
| 25 - 34 | 24 | =(LEFT(A4,2)+RIGHT(A4,2))/2 |
| 35 - 54 | 20 | =(LEFT(A5,2)+RIGHT(A5,2))/2 |
| 55 - 74 | 18 | =(LEFT(A6,2)+RIGHT(A6,2))/2 |
| 75+ | 28 | 80 |
B)

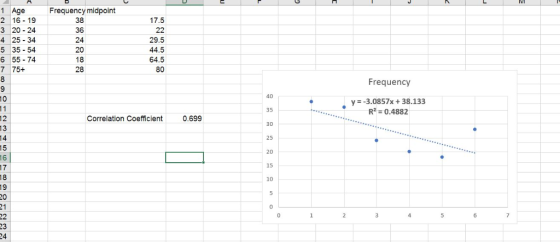
c) Correlation Coefficeint
0.699
R-squared in the chart is 0.4882
Calculating R:
sqrt(o.4882) = 0.699
r = 0.699
e) predict the number of deaths in the age of 40 and 60
x =40
Regression equation is y = -3.0857x + 38.133
y = -3.0857*40 + 38.133
y = -85.30
-------------------------------------------------------------------------------
x =60
y = -3.0857*60 + 38.133
y = -147.01
f)
Relationship:
There is a negative linear relationship between Age and driver fatality rate
g) slope:
-3.0857 is the slope of the linear regression
(check the above graph)
Add Answer to:
67. Recently, the annual number of driver deaths per 100,000 for the selected age groups was as follows: Age Number of Driver Deaths per 100,000 16-19 38 20-24 36 25-34 24 35-54 20 55-74 18 75+ 28 Ta...
Linear Regression and Correlation Activity Recently, the annual number of driver deaths per 100,000 for the...
 Linear Regression and Correlation Activity Recently, the annual number of driver deaths per 100,000 for the selected age groups was as follows: Age 16 - 19 20-24 25 - 34 35 - 54 55 - 74 75+ Number of Driver Death per 100,000 38 36 24 20 18 28 5. Predict the number of deaths for ages 40 and 60 (use the midpoint when finding the prediction).
Linear Regression and Correlation Activity Recently, the annual number of driver deaths per 100,000 for the...
 Linear Regression and Correlation Activity Recently, the annual number of driver deaths per 100,000 for the selected age groups was as follows: Age 16 - 19 20-24 25-34 35 - 54 55 - 74 75+ Number of Driver Death per 100,000 38 36 24 20 18 28 1. For each age group, list out the midpoints of the intervals for the x values. (For the 75+ group, use 80. 2. Find the correlation using the formular = η Σχy)-(Σχ)(Σy) Vin...
7. [4/15 Points) DETAILS PREVIOUS ANSWERS in a certain year the number of driver deaths per...
 7. [4/15 Points) DETAILS PREVIOUS ANSWERS in a certain year the number of driver deaths per 100,000 for the different age groups was as follows: Number of Driver Deaths per 100,000 27 18 Age 15-24 25-39 40-69 70-79 80+ 11 18 22 Part(a) For each age group, pick the midpoint of the interval for the x-value. (For the 80+ group, use 85.) Age group Midpoint 15-24 195 ✓ 25-39 32 ✓ 40-69 54.5 ✓ 70-79 74.5 ✓ 80+ 85 Part...
Linear Regression and Correlation Activity Recently, the annual number of driver deaths per 100,000 for the...
 Linear Regression and Correlation Activity Recently, the annual number of driver deaths per 100,000 for the selected age groups was as follows: Age 16 - 19 20-24 25 - 34 35 - 54 55 - 74 75+ Number of Driver Death per 100,000 38 36 24 20 18 28 4. Can we use the regression line to make reliable prediction of the number of deaths per 100,000? (Is there a significant correlation between the two factors?) a. Find the p-value...
 Linear Regression and Correlation Activity Recently, the annual number of driver deaths per 100,000 for the selected age groups was as follows: Age 16 - 19 20-24 25 - 34 35 - 54 55 - 74 75+ Number of Driver Death per 100,000 38 36 24 20 18 28 5. Predict the number of deaths for ages 40 and 60 (use the midpoint when finding the prediction).
 Linear Regression and Correlation Activity Recently, the annual number of driver deaths per 100,000 for the selected age groups was as follows: Age 16 - 19 20-24 25-34 35 - 54 55 - 74 75+ Number of Driver Death per 100,000 38 36 24 20 18 28 1. For each age group, list out the midpoints of the intervals for the x values. (For the 75+ group, use 80. 2. Find the correlation using the formular = η Σχy)-(Σχ)(Σy) Vin...
 7. [4/15 Points) DETAILS PREVIOUS ANSWERS in a certain year the number of driver deaths per 100,000 for the different age groups was as follows: Number of Driver Deaths per 100,000 27 18 Age 15-24 25-39 40-69 70-79 80+ 11 18 22 Part(a) For each age group, pick the midpoint of the interval for the x-value. (For the 80+ group, use 85.) Age group Midpoint 15-24 195 ✓ 25-39 32 ✓ 40-69 54.5 ✓ 70-79 74.5 ✓ 80+ 85 Part...
 Linear Regression and Correlation Activity Recently, the annual number of driver deaths per 100,000 for the selected age groups was as follows: Age 16 - 19 20-24 25 - 34 35 - 54 55 - 74 75+ Number of Driver Death per 100,000 38 36 24 20 18 28 4. Can we use the regression line to make reliable prediction of the number of deaths per 100,000? (Is there a significant correlation between the two factors?) a. Find the p-value...
Most questions answered within 3 hours.
-
The manager at a car assembly plant believes that the mean
assembly time for a car...
asked 47 minutes ago -
Which of the following is true of electron capture?
A) It decreases the nuclide's mass number...
asked 2 hours ago -
Assuming an efficiency of 43.10%, calculate the actual yield of
magnesium nitrate formed from 114.9 g...
asked 2 hours ago -
The highly pathogenic bacterium Clostridium
perfringens causes gangrene, a disease that results in the
destruction of...
asked 4 hours ago -
In the context of situation analysis, which of the following is
a category for analysis in...
asked 4 hours ago -
In a study of the gas phase decomposition of sulfuryl chloride
at 600 K SO2Cl2(g)SO2(g) +...
asked 4 hours ago -
75 g of 2-propanol (C3H8O) and 25 g of pentane are mixed in a
200 mL...
asked 4 hours ago -
The 2800-turn coil in a dc motor has an area per turn of 1.1 ×
10-2...
asked 4 hours ago -
Draw a combinational logic circuit diagram with a symbol inside
the box for two I/P of...
asked 4 hours ago -
The cliché we use quite a lot in finance is: there is a need to
maximize...
asked 5 hours ago -
In class we discussed the addition of HCl to alpha pinene. Would
you expect one or...
asked 5 hours ago -
I'm trying to explain to my daughter to help her please help
me
I tagged the...
asked 5 hours ago