1) State all relevant hypotheses (nulls and alternatives). 2) State which test was used and why you used it. 3) State conclusions after completing your analyses. a. Use an appropriate test to evaluate...
1) State all relevant hypotheses (nulls and alternatives).
2) State which test was used and why you used it.
3) State conclusions after completing your analyses.
a. Use an appropriate test to evaluate whether position in the batting order and bat speed contribute to the number of home runs (HR) hit per season. Keep in mind that we would like to be able to make inferences about the influence of bat speed across the entire range observed within Major League Baseball, not just the random bat speeds that we tested.
b. Make a single plot of the mean responses at each level of both factors and evaluate.
| batting order slot | bat speed | HR per season |
| Top | Fast | 24 |
| Middle | Fast | 41 |
| Bottom | Fast | 21 |
| Top | Fast | 15 |
| Middle | Fast | 34 |
| Bottom | Fast | 18 |
| Top | Fast | 12 |
| Middle | Fast | 29 |
| Bottom | Fast | 14 |
| Top | Slow | 13 |
| Middle | Slow | 24 |
| Bottom | Slow | 8 |
| Top | Slow | 11 |
| Middle | Slow | 27 |
| Bottom | Slow | 12 |
| Top | Slow | 6 |
| Middle | Slow | 18 |
| Bottom | Slow | 9 |
Homework Answers
SOLUTION
> data1=read.csv(file.choose(),header=T)
> names(data1)
[1] "batting.order.slot" "bat.speed" "HR.per.season"
> attach(data1)
The following objects are masked from data1 (pos = 4):
bat.speed, batting.order.slot, HR.per.season
b). > xyplot(HR.per.season~batting.order.slot|bat.speed,pch=16)
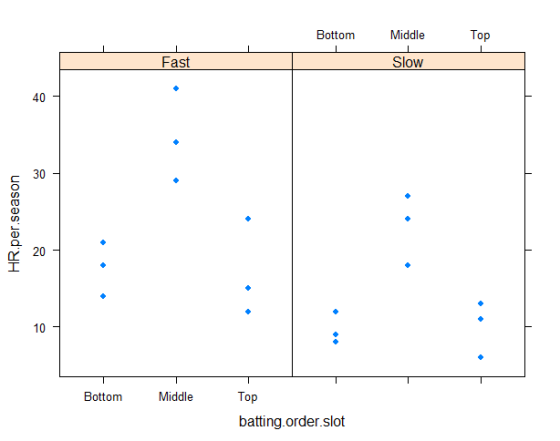
> by(HR.per.season,list(batting.order.slot,bat.speed),FUN =
mean)
: Bottom
: Fast
[1] 17.66667
---------------------------------------------------------------
: Middle
: Fast
[1] 34.66667
---------------------------------------------------------------
: Top
: Fast
[1] 17
---------------------------------------------------------------
: Bottom
: Slow
[1] 9.666667
---------------------------------------------------------------
: Middle
: Slow
[1] 23
---------------------------------------------------------------
: Top
: Slow
[1] 10
a) 1. Null hypothesis -> 
Alternative hypothesis -> H1A : not
H0A
H1B : not H0B,

where 
and 
2. Two-way ANOVA with replications has been used since we have two factors Batting order slot and batting speed and we have more than observation for each combination of the two factors.
3..>
model=aov(HR.per.season~batting.order.slot+bat.speed)
> summary(model)
Df Sum Sq Mean Sq F value Pr(>F)
batting.order.slot 2 930.3 465.2 24.11 2.92e-05 ***
bat.speed 1 355.6 355.6 18.43 0.000744 ***
Residuals 14 270.1 19.3
---
Signif. codes: 0 ‘***’ 0.001 ‘**’ 0.01 ‘*’ 0.05 ‘.’ 0.1 ‘ ’ 1
Since p-value for both the factors are very small, we reject both
the null hypotheses and conclude that both batting order slot and
batting speed significantly affect the HR per season.
Add Answer to:
1) State all relevant hypotheses (nulls and alternatives). 2) State which test was used and why you used it. 3) State conclusions after completing your analyses. a. Use an appropriate test to evaluate...
a. Use an appropriate test to evaluate whether position in the batting order and bat speed contribute to the number of home runs (HR) hit per season. Keep in mind that we would like to be able to make...
a. Use an appropriate test to evaluate whether position in the batting order and bat speed contribute to the number of home runs (HR) hit per season. Keep in mind that we would like to be able to make inferences about the influence of bat speed across the entire range observed within Major League Baseball, not just the random bat speeds that we tested. b. Make a single plot of the mean responses at each level of both factors and...
Most questions answered within 3 hours.
-
A business executive has the option to invest money in two
plans: Plan A guarantees that...
asked 1 hour ago -
Hello, can someone please help me answer this question?
How much heat is absorbed by a...
asked 1 hour ago -
. A marketing researcher conducted a survey of 25 shoppers
randomly selected at the local mall...
asked 1 hour ago -
Create an comprehensive response to the
following:
Antimicrobial agents work on a multitude of microbes (bacteria,...
asked 1 hour ago -
6.13 LAB: Step counter. Section 6.3.
A pedometer treats walking 2,000 steps as walking 1 mile....
asked 1 hour ago -
(14.2) A block of mass m = 10 kg riding on a frictionless
horizontal plane is...
asked 1 hour ago -
Use any search engine to search for articles about Starbucks
partnership with Tata Companies in India...
asked 1 hour ago -
Let’s say that for some reason Bank Excess Reserves suddenly
increase sharply. What effect would this...
asked 1 hour ago -
Given:
Curent Assets: $600,000
Total Assets: $2,600,000
Current Liabilities: $500,000
Total Liabilities: $1,700,000
What is the...
asked 1 hour ago -
1. What is a “Bankster”? What is insider trading? Why is it
illegal?
2. What is...
asked 1 hour ago -
A transverse wave on a cord is given by
D(x,t)=0.18sin(2.7x−61.0t), where Dand x are in m...
asked 1 hour ago -
ASSIGNMENT
ANSWER ANY TWO OF THE FOLLOWING IN 2-3 PARAGRAPHS OF EACH
QUESTION.
1: Where is...
asked 1 hour ago