
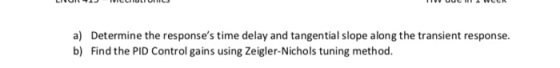
a) b) Determine the response's time delay and tangential slope along the transient response. Find the PID Control gains using Zeigler-Nichols tuning method.
Homework Answers
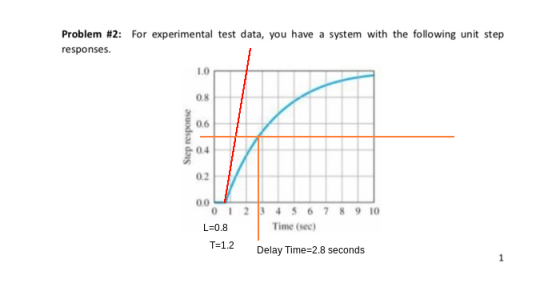
Referring figure above, L=0.8 and T=1.2.
a)
Inflection point is observed at t=0.8 seconds(approximately).
Time delay is the time taken by the response to reach 50% of
final value. i.e., 50% 0f 1 = 0.5. Hence, from figure, delay time
can be approximated to 
Tangent drawn is shown by red line. Tangential Slope = 

Slope Angle = 
b)
With L=0.8 and T=1.2, PID Control Gains are


Add Answer to:
Problem #2: For experimental test data, you have a system with the following unit step responses. 1.0 0.8 0.6 0.4 0.2 0123456789 10 Time (sec) a) b) Determine the response's time delay and t...
Problem #3: For an open-loop step response that yields the following data: Pseudo delays 8 ms and time difference T·12 ms. a) Find the PID Control gains using Zeigler-Nichols tuning method....
 Problem #3: For an open-loop step response that yields the following data: Pseudo delays 8 ms and time difference T·12 ms. a) Find the PID Control gains using Zeigler-Nichols tuning method.
Problem #3: For an open-loop step response that yields the following data: Pseudo delays 8 ms and time difference T·12 ms. a) Find the PID Control gains using Zeigler-Nichols tuning method.
Problem #3: For an open-loop step response that yields the following data: Pseudo delays 8 ms and time difference T·12 ms. a) Find the PID Control gains using Zeigler-Nichols tuning method.
Problem 2. Figure 1 shows the function f (x) = v 1-x2 along with 200 random points distributed uniformly in the unit square. Use this information to estimate t. Explain your method. 1.0 0.8 0.6 0.4t...
 Problem 2. Figure 1 shows the function f (x) = v 1-x2 along with 200 random points distributed uniformly in the unit square. Use this information to estimate t. Explain your method. 1.0 0.8 0.6 0.4t 0.0 0.0 0.2 0.4 0.6 1.0 Figure 1: 200 uniformly distributed points in the unit square, and the curve f(x)- V1-r' 0.8
Problem 2. Figure 1 shows the function f (x) = v 1-x2 along with 200 random points distributed uniformly in the unit...
Problem 2. Figure 1 shows the function f (x) = v 1-x2 along with 200 random points distributed uniformly in the unit square. Use this information to estimate t. Explain your method. 1.0 0.8 0.6 0.4t 0.0 0.0 0.2 0.4 0.6 1.0 Figure 1: 200 uniformly distributed points in the unit square, and the curve f(x)- V1-r' 0.8
Problem 2. Figure 1 shows the function f (x) = v 1-x2 along with 200 random points distributed uniformly in the unit...
distance (meters) 2 1 time (seconds) 0.2 0.4 0.6 0.8 Data from R. B. Huey and...
 distance (meters) 2 1 time (seconds) 0.2 0.4 0.6 0.8 Data from R. B. Huey and P. E. Hertz, "Effects of Body Size and Slope on the Acceleration of a Lizard," J. Exp. Biol, Volume 110, 1984, p. 113-123 (a) If the lizard were running faster and faster, what would be the concavity of the graph? Does this match what you see? The graph looks If the lizard were running faster and faster, the graph would be UNK то TEXT...
3. (10pts) Consider the follow population curves that are solutions for the worm-robins from a predictor-prey system 1.8 1.6 1.4 1.2 Rabins 05 1 15 2 3 0.8 0.6 0.4 0.2 2 2.4S Problem 3 10 15 25 T...
 3. (10pts) Consider the follow population curves that are solutions for the worm-robins from a predictor-prey system 1.8 1.6 1.4 1.2 Rabins 05 1 15 2 3 0.8 0.6 0.4 0.2 2 2.4S Problem 3 10 15 25 Time t (a) There are two trajectories drawn on the left. Which one seems to correspond to the solutions? Indicate the initial point and its moving direction. Explain. the rate of population of either warm or robins is zero. system to complete...
 Problem #3: For an open-loop step response that yields the following data: Pseudo delays 8 ms and time difference T·12 ms. a) Find the PID Control gains using Zeigler-Nichols tuning method.
Problem #3: For an open-loop step response that yields the following data: Pseudo delays 8 ms and time difference T·12 ms. a) Find the PID Control gains using Zeigler-Nichols tuning method.
Problem #3: For an open-loop step response that yields the following data: Pseudo delays 8 ms and time difference T·12 ms. a) Find the PID Control gains using Zeigler-Nichols tuning method.
 Problem 2. Figure 1 shows the function f (x) = v 1-x2 along with 200 random points distributed uniformly in the unit square. Use this information to estimate t. Explain your method. 1.0 0.8 0.6 0.4t 0.0 0.0 0.2 0.4 0.6 1.0 Figure 1: 200 uniformly distributed points in the unit square, and the curve f(x)- V1-r' 0.8
Problem 2. Figure 1 shows the function f (x) = v 1-x2 along with 200 random points distributed uniformly in the unit...
Problem 2. Figure 1 shows the function f (x) = v 1-x2 along with 200 random points distributed uniformly in the unit square. Use this information to estimate t. Explain your method. 1.0 0.8 0.6 0.4t 0.0 0.0 0.2 0.4 0.6 1.0 Figure 1: 200 uniformly distributed points in the unit square, and the curve f(x)- V1-r' 0.8
Problem 2. Figure 1 shows the function f (x) = v 1-x2 along with 200 random points distributed uniformly in the unit...
 distance (meters) 2 1 time (seconds) 0.2 0.4 0.6 0.8 Data from R. B. Huey and P. E. Hertz, "Effects of Body Size and Slope on the Acceleration of a Lizard," J. Exp. Biol, Volume 110, 1984, p. 113-123 (a) If the lizard were running faster and faster, what would be the concavity of the graph? Does this match what you see? The graph looks If the lizard were running faster and faster, the graph would be UNK то TEXT...
 3. (10pts) Consider the follow population curves that are solutions for the worm-robins from a predictor-prey system 1.8 1.6 1.4 1.2 Rabins 05 1 15 2 3 0.8 0.6 0.4 0.2 2 2.4S Problem 3 10 15 25 Time t (a) There are two trajectories drawn on the left. Which one seems to correspond to the solutions? Indicate the initial point and its moving direction. Explain. the rate of population of either warm or robins is zero. system to complete...
Most questions answered within 3 hours.
-
The length of a pencil is measured to be 10.00 cm with a ruler.
What is...
asked 6 seconds from now -
A 120 cm^3 box contains helium at a pressure of 1.80 atm and a
temperature of...
asked 5 minutes ago -
Given that Kb for the weak base analine is 3.8 X
10-10, which of the following...
asked 7 minutes ago -
A uniform, solid sphere of radius 4.50 cm and mass 4.50 kg
starts with a purely...
asked 4 minutes ago -
A sniper fires a rifle bullet into a gasoline tank, making a
hole 51.0 m below...
asked 8 minutes ago -
The US Census Bureau gathered data regarding yearly gas sales
for residents of different states. Wyoming...
asked 28 minutes ago -
A person in a casino decides to play blackjack until he loses a
game, but he...
asked 31 minutes ago -
mode field diameter (MFD) is an important parameter in
characterizing single mode fibre properties which takes...
asked 22 minutes ago -
Question 4: What is the significance of those strange
“36.79%” and “63.21%” numbers the procedure? That...
asked 28 minutes ago -
Rules of implementation!:
You may NOT modify any of the files except Expression.java in
ANY way....
asked 29 minutes ago -
Arbitration of disputes under the purview of "lemon laws" under
state statute is:
not required by...
asked 43 minutes ago -
Describe three pieces of evidence that mitochondria and evolved
from symbiotic mutualisms between a eukaryote (or...
asked 50 minutes ago