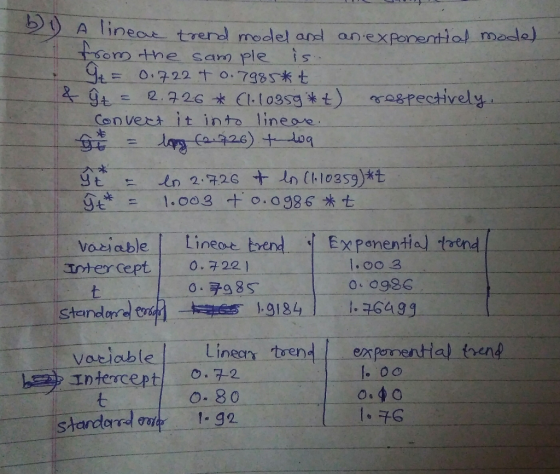
The accompanying data file contains 20 observations for
t and yt.
Actual series are plotted along with the superimposed linear and exponential trends.
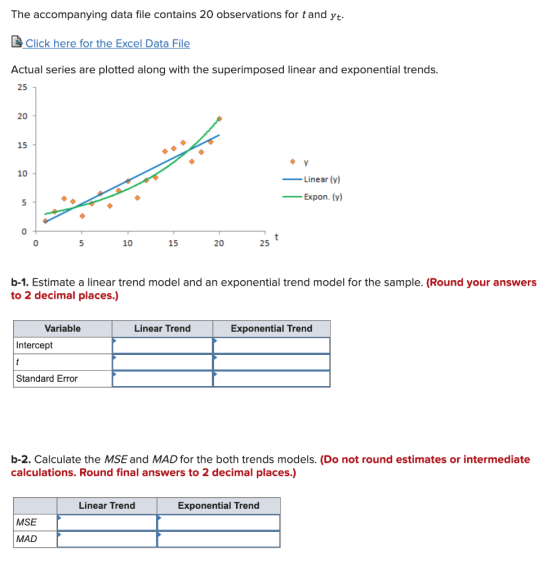

| t | y | t | y | t | y | t | y |
| 1 | 1.91 | 6 | 4.93 | 11 | 5.96 | 16 | 15.58 |
| 2 | 3.57 | 7 | 6.78 | 12 | 9.02 | 17 | 12.33 |
| 3 | 5.83 | 8 | 4.58 | 13 | 9.52 | 18 | 13.95 |
| 4 | 5.39 | 9 | 7.19 | 14 | 14.02 | 19 | 15.63 |
| 5 | 2.78 | 10 | 8.81 | 15 | 14.57 | 20 | 19.77 |
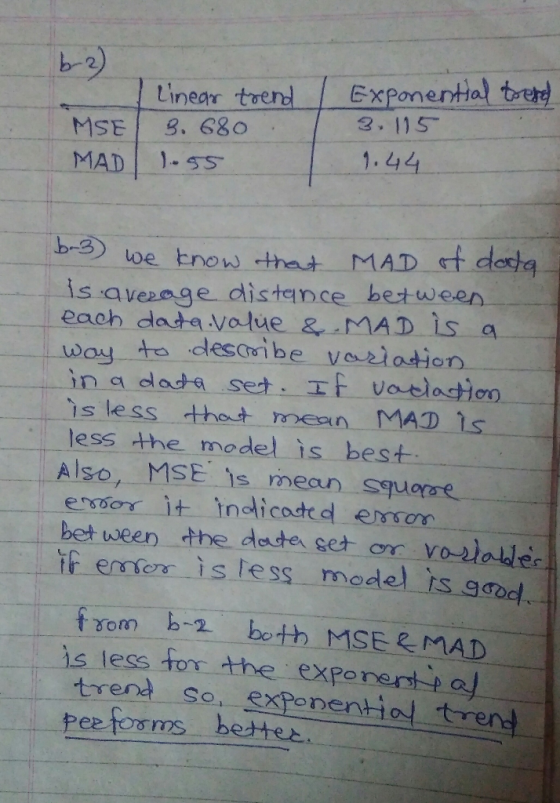
b-3. By comparing MSE and MAD, which of the above methods perform better? Exponential trend performs better Linear trend performs better
Homework Answers
Add Answer to:
The accompanying data file contains 20 observations for t and yt. Actual series are plotted along with the superimposed linear and exponential trends. t y t y t y t y 1 1.91 6 4.93...
The accompanying data file contains 20 observations for tand yt: Click here for the Excel Data...
 The accompanying data file contains 20 observations for tand yt: Click here for the Excel Data File Actual series are plotted along with the superimposed linear and exponential trends. 25 20 15 • Y 10 Linearly Expon. (v) 5 0 0 10 15 20 25 b-1. Estimate a linear trend model and an exponential trend model for the sample. (Round your answers to 2 decimal places.) Exponential Trend Variable Intercept Linear Trend 0.43 0.84 0.10 Standard Error b-2. Calculate the...
The accompanying data file contains 20 observations fort and yt: Click here for the Excel Data...
 The accompanying data file contains 20 observations fort and yt: Click here for the Excel Data File Actual series are plotted along with the superimposed linear and exponential trends. 25 20 15 Y 10 5 Linearly Expon.lv 0 10 15 20 25 b-1. Estimate a linear trend model and an exponential trend model for the sample. (Round your answers to 2 decimal places.) Linear Trend Exponential Trend Variable Intercept t Standard Error b-1. Estimate a linear trend model and an...
Check my work 4 Click here for the Excel Data File Actual series are plotted along...
 Check my work 4 Click here for the Excel Data File Actual series are plotted along with the superimposed linear and exponential trends. 25 8.33 points 20 eBook 15 Hint 10 Print -Linear (y) Expon. (y) References 5 0 t 0 5 10 15 20 25 b-1. Estimate a linear trend model and an exponential trend model for the sample. (Round your answers to 2 decimal places.) Variable Linear Trend Exponential Trend Intercept t Standard Error Ch 4 Linear Trend...
The accompanying data file contains 10 observations for t and yt. picture Click here for the...
 The accompanying data file contains 10 observations for t and yt. picture Click here for the Excel Data File A 3-period moving average is plotted along with the actual series. 15 14 13 12 11 - 10 LA 9 8- 7- 6 5 0 1 2 3 4 6 7 8 9 10 rk Ch 18 Saved Help Save & Exit su Check my we b-1. Use the 3-period moving average to make in-sample forecasts. (Round intermediate calculations to at...
Despite the growth in digital entertainment, the nation's 400 amusement parks have managed to hold on...
 Despite the growth in digital entertainment, the nation's 400 amusement parks have managed to hold on to visitors. A manager collects data on the number of visitors (in millions) to amusement parks in the United States. A portion of the data is shown in the accompanying table. Year 2000 Visitors 360 322 2001 2007 320 SOURCE: International Association of Amusement Parks and Attractions. 5 Daicture Click here for the Excel Data File b-1. Estimate a linear trend model and an...
Despite the growth in digital entertainment, the nation's 400 amusement parks have managed to hold on...
 Despite the growth in digital entertainment, the nation's 400 amusement parks have managed to hold on to visitors. A manager collects data on the number of visitors (in millions) to amusement parks in the United States. A portion of the data is shown in the accompanying table. Year 2000 2001 Visitors 358 334 2007 318 SOURCE: International Association of Amusement Parks and Attractions. picture Click here for the Excel Data File b-1. Estimate a linear trend model and an exponential...
Consider the following time series data. Week 1 2 3 4 5 6 Value 19 11 16 1017 15 (a) Construct a ...
 Consider the following time series data. Week 1 2 3 4 5 6 Value 19 11 16 1017 15 (a) Construct a time series plot. 20 20 20 18 16 14 12 10 c 14 12 12 0 23 4 5 67 0 23 4 5 67 Week Weck Week 20 18 0 1 2345 6 7 Week What type of pattern exists in the data? The data appear to follow a seasonal pattern. The data appear to follow a...
This is the third time I've had to post this because the answers I've been getting...
 This is the third time I've had to post this because the answers
I've been getting have been incorrect. All of the answers
that are filled in are correct. please help if you can
Despite the growth in digital entertainment, the nation's 400 amusement parks have managed to hold on to visitors. A manager collects data on the number of visitors (in millions) to amusement parks in the United States. A portion of the data is shown in the accompanying...
This is the third time I've had to post this because the answers
I've been getting have been incorrect. All of the answers
that are filled in are correct. please help if you can
Despite the growth in digital entertainment, the nation's 400 amusement parks have managed to hold on to visitors. A manager collects data on the number of visitors (in millions) to amusement parks in the United States. A portion of the data is shown in the accompanying...
Need help with #2. The data set mentioned is the numbers that are provided. 7.pdf Get Homework Help With Chege + × Homework%20%237.pdf Does the three-month or four-month moving average provide more ac...
 Need help with #2. The data set mentioned is the numbers that
are provided.
7.pdf Get Homework Help With Chege + × Homework%20%237.pdf Does the three-month or four-month moving average provide more accurate d) forecasts based on MSE? What is the forecast for the next month using the better forecasting method e) you decided in part d)? Problem 13 on Page 822. The values of Alabama building contracts (in Smillions) for a 12-month period follow. 240 350 230 260 280...
Need help with #2. The data set mentioned is the numbers that
are provided.
7.pdf Get Homework Help With Chege + × Homework%20%237.pdf Does the three-month or four-month moving average provide more accurate d) forecasts based on MSE? What is the forecast for the next month using the better forecasting method e) you decided in part d)? Problem 13 on Page 822. The values of Alabama building contracts (in Smillions) for a 12-month period follow. 240 350 230 260 280...
 The accompanying data file contains 20 observations for tand yt: Click here for the Excel Data File Actual series are plotted along with the superimposed linear and exponential trends. 25 20 15 • Y 10 Linearly Expon. (v) 5 0 0 10 15 20 25 b-1. Estimate a linear trend model and an exponential trend model for the sample. (Round your answers to 2 decimal places.) Exponential Trend Variable Intercept Linear Trend 0.43 0.84 0.10 Standard Error b-2. Calculate the...
 The accompanying data file contains 20 observations fort and yt: Click here for the Excel Data File Actual series are plotted along with the superimposed linear and exponential trends. 25 20 15 Y 10 5 Linearly Expon.lv 0 10 15 20 25 b-1. Estimate a linear trend model and an exponential trend model for the sample. (Round your answers to 2 decimal places.) Linear Trend Exponential Trend Variable Intercept t Standard Error b-1. Estimate a linear trend model and an...
 Check my work 4 Click here for the Excel Data File Actual series are plotted along with the superimposed linear and exponential trends. 25 8.33 points 20 eBook 15 Hint 10 Print -Linear (y) Expon. (y) References 5 0 t 0 5 10 15 20 25 b-1. Estimate a linear trend model and an exponential trend model for the sample. (Round your answers to 2 decimal places.) Variable Linear Trend Exponential Trend Intercept t Standard Error Ch 4 Linear Trend...
 The accompanying data file contains 10 observations for t and yt. picture Click here for the Excel Data File A 3-period moving average is plotted along with the actual series. 15 14 13 12 11 - 10 LA 9 8- 7- 6 5 0 1 2 3 4 6 7 8 9 10 rk Ch 18 Saved Help Save & Exit su Check my we b-1. Use the 3-period moving average to make in-sample forecasts. (Round intermediate calculations to at...
 Despite the growth in digital entertainment, the nation's 400 amusement parks have managed to hold on to visitors. A manager collects data on the number of visitors (in millions) to amusement parks in the United States. A portion of the data is shown in the accompanying table. Year 2000 Visitors 360 322 2001 2007 320 SOURCE: International Association of Amusement Parks and Attractions. 5 Daicture Click here for the Excel Data File b-1. Estimate a linear trend model and an...
 Despite the growth in digital entertainment, the nation's 400 amusement parks have managed to hold on to visitors. A manager collects data on the number of visitors (in millions) to amusement parks in the United States. A portion of the data is shown in the accompanying table. Year 2000 2001 Visitors 358 334 2007 318 SOURCE: International Association of Amusement Parks and Attractions. picture Click here for the Excel Data File b-1. Estimate a linear trend model and an exponential...
 Consider the following time series data. Week 1 2 3 4 5 6 Value 19 11 16 1017 15 (a) Construct a time series plot. 20 20 20 18 16 14 12 10 c 14 12 12 0 23 4 5 67 0 23 4 5 67 Week Weck Week 20 18 0 1 2345 6 7 Week What type of pattern exists in the data? The data appear to follow a seasonal pattern. The data appear to follow a...
 This is the third time I've had to post this because the answers
I've been getting have been incorrect. All of the answers
that are filled in are correct. please help if you can
Despite the growth in digital entertainment, the nation's 400 amusement parks have managed to hold on to visitors. A manager collects data on the number of visitors (in millions) to amusement parks in the United States. A portion of the data is shown in the accompanying...
This is the third time I've had to post this because the answers
I've been getting have been incorrect. All of the answers
that are filled in are correct. please help if you can
Despite the growth in digital entertainment, the nation's 400 amusement parks have managed to hold on to visitors. A manager collects data on the number of visitors (in millions) to amusement parks in the United States. A portion of the data is shown in the accompanying...
 Need help with #2. The data set mentioned is the numbers that
are provided.
7.pdf Get Homework Help With Chege + × Homework%20%237.pdf Does the three-month or four-month moving average provide more accurate d) forecasts based on MSE? What is the forecast for the next month using the better forecasting method e) you decided in part d)? Problem 13 on Page 822. The values of Alabama building contracts (in Smillions) for a 12-month period follow. 240 350 230 260 280...
Need help with #2. The data set mentioned is the numbers that
are provided.
7.pdf Get Homework Help With Chege + × Homework%20%237.pdf Does the three-month or four-month moving average provide more accurate d) forecasts based on MSE? What is the forecast for the next month using the better forecasting method e) you decided in part d)? Problem 13 on Page 822. The values of Alabama building contracts (in Smillions) for a 12-month period follow. 240 350 230 260 280...
Most questions answered within 3 hours.
-
Ammonia will decompose into nitrogen and hydrogen at high
temperature. An industrial chemist studying this reaction...
asked 1 minute ago -
10. Complete the table below
only using hexadecimal numbers:
AL CODE
EBX
EAX
[EAX]
mov eax,...
asked 19 minutes ago -
trust is best established through the combination of ------and
------- .
1. magnanimity and justice
2....
asked 34 minutes ago -
Blood pressure is normally taken on the upper arm at the level
of the heart. Suppose,...
asked 32 minutes ago -
Suppose that the satellite around the earth has an orbit that is
24 KM larger in...
asked 36 minutes ago -
Calculate the [OH (aq)] in limes which have a [H3O*(aq)] of 1.3 x
10 mol/L
asked 34 minutes ago -
A nozzle with a radius of 0.250 cm is attached to a garden hose
with a...
asked 45 minutes ago -
PLEASE do not use any loops for the program; only recursion is
allowed
4. Write a...
asked 54 minutes ago -
Please help me with me. I did the first part to write the operations but in...
asked 51 minutes ago -
Use Cryptool to find the Cryptographic SHA-1 hash value of the
string "abc". The calculator is...
asked 55 minutes ago -
You are attempting to calculate a firm’s free cash flow to
equity. You know the following...
asked 1 hour ago -
the following reaction occurs in a balloon containing
N2O2 gas
N2O4(g)=2NO2(g)
will the volume of the...
asked 2 hours ago