
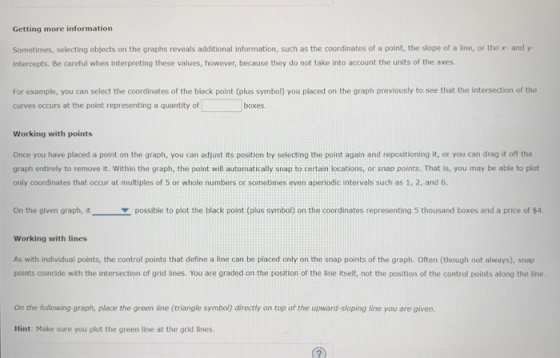


Getting more information Sometimes, selecting objects on the graphs reveals additional information, such as the coordinates of a point, the slope of a line, or the x- and y intercepts. Be careful when interpreting these values, however, because they do not take into account the units of the axes. For example, you can select the coordinates of the black point (plus symbol) you placed on the graph previously to see that the intersection of the curves occurs at the point representing a quantity of boxes Working with points Once you have placed a point on the graph, you can adjust its position by selecting the point again and repositioning it, or you can drag it off the graph entirely to remove it. Within the graph, the point will automatically snap to certain locations, or snap points. That is, you may be able to plot only coordinates that occur at multiples of 5 or whole numbers or sometimes even aperiodic intervals such as 1, 2, and 6 On the given graph, it possible to plot the black point (plus symbol) on the coordinates representing 5 thousand boxes and a price of $4, Working with lines As with Individual points, the control points that define a line can be placed only on the snap points of the graph. Often (though not always), snap points coincide with the intersection of grid lines. You are graded on the position of the line itself, not the position of the control points along the line. On the following graph, place the green line (triangle symbol) directly on top of the upward-sloping line you are given. Hint: Make sure you plot the green line at the grid lines.
Hint: Make sure you plot the green line at the grid lines. Line 1 Line 2 0 2 4 6 8 10 1214 16 18 20 QUANTITY (Thousands of boxes) True or False: The vertical intercept of the line will always be a snap point. O True False
Adjusting lines Once you have placed a line on the graph, you can move the entire object without changing the slope by selecting any part of the line other than the control points, and then dragging it up, down, left, or right to the desired location. To remove the line from the graph entirely, you can select either a control point or the line itself and drag it off the graph. Place the purple line (diamond symbol), labeled Line 2, on top of Line 1. Then, without selecting the control points, shift Line 2 up by $1 at every quantity Understanding graph grading After you hit the Check Answer button, each palette icon ill be marked with either a green check or a red X, Indicating whether that object was placed correctly or incorrectly on the graph. In addition to the standard explanations that appear for all questions, a correct version of the graph wil also appear next to each graph you constructed. Select this graph (labeled Correct Answer) to swap its position with that of the graph you submitted and to see an enlarged version of it. To switch back to the view with your graded graph being enlarged, select the smaller graph now labeled Your Answer. Note: Not all graphs are graded, some are simply given to you to assist with answering the rest of the question. Unless the instructions tell you that a particular graph is not graded, assume that it will be graded. Which of the following statements regarding the graphs tool are correct? Check all that apply All graphs contain at least one graded element. The correct version of a graded graph will appear after you place the final element on the graph. 目Once you select the Correct Answer graph, you can return to the view where Your Answer is larger by selecting the Your Answer graph.
Homework Answers
1.
Intersection of 2 curves occurs at quantity 6 (thousand) boxes.
2.
On the given graph, it is not possible to plot the black point on the coordinates representing 5 thousand boxes at $4 price.
3.
The vertical intercept is not always a snap point. (Correct option false)
4.
Which is true about graph tools?
Option 3. As explained in the sections above the question.
Add Answer to:
Answer all of these, please Using Aplia graphs me questions will ask you to interpret a given oraph, and others will require you to manipulate the objects on the graph or even add new required...
Using Aplia graphs Some questions will ask you to interpret a given graph, and others will...
 Using Aplia graphs Some questions will ask you to interpret a given graph, and others will require you to manipulate the objects on the graph or even add new required objects. Each manipulable object will be shown in the area to the right of the graph (the palette) and referred to by its color, object type, and shape of the control points, for example, black point (plus symbol). To place an object on the graph, select it from the palette...
6. The graphs tool Using Aplia graphs Some questions will ask you to interpret a given...
 6. The graphs tool Using Aplia graphs Some questions will ask you to interpret a given graph, and others will require you to manipulate the objects on the graph or even add new required objects. Each manipulable object wil be shown in the area to the right of the graph (the palet the control points, for example, black point (plus symbol). To piace an object on the graph, select it from the palette and drag it onto the graph itself....
Working with lines As with individual points, the control points that define a line can be...
 Working with lines As with individual points, the control points that define a line can be placed only on the snap points of the graph. Often (though not always), snap points coincide with the intersection of grid lines. You are graded on the position of the line itself, not the position of the control points along the line. On the following graph, place the green line (triangle symbol) directly on top of the upward-sioping line you are given. Hint: Make...
10. The shifter tool Another manipulable graph object The shifter tool is designed to let you...
 10. The shifter tool Another manipulable graph object The shifter tool is designed to let you answer questions by shifting entire lines or points along a line (or both) from one position to another. You can select any part of the line and drag it to the left or to the right. Once you have moved the point or line far enough, it will snap into one of a few possible positions. Shift the blue demand line (labeled D) to...
The endpoint mover Manipulating objects already on the graph Some graphs will allow you to manipulate...
 The endpoint mover Manipulating objects already on the graph Some graphs will allow you to manipulate the endpoints of given lines or curves. When you select an endpoint mover line, the endpoints will appear empty white points that can be selected and moved to one of three prespecified snap points (including the original position). How do I know whether a line on a graph is movable? All endpoint mover objects will be accompanied by a greyed-out, labeled symbol on the...
We were unable to transcribe this imageWorking with curves Each curve that you place on the...
 We were unable to transcribe this imageWorking with curves Each curve that you place on the graph will have at least three control points connected by a curved line. Rather than dragging each point onto the graph from the palette individually (as with connected points), you must drag the entire object onto the graph as a single unit. You can then change the shape by selecting and dragging one of the control points, or you can move the entire curve...
Please clearly label the graphs and show all the work. Thank you :) 2. Economic fluctuations...
 Please clearly label
the graphs and show all the work. Thank you :)
2. Economic fluctuations and growth The following table shows data on a hypothetical country's real GDP from 1980 through 1988: Year 1980 1981 1982 1983 1984 1985 1986 1987 1988 Real GDP (Billions of Dollars) 465 475 480 505 500 485 490 500 505 The green line on the following graph shows the economy's long-term growth trend Use the blue points (circle symbol) to plot the real...
Please clearly label
the graphs and show all the work. Thank you :)
2. Economic fluctuations and growth The following table shows data on a hypothetical country's real GDP from 1980 through 1988: Year 1980 1981 1982 1983 1984 1985 1986 1987 1988 Real GDP (Billions of Dollars) 465 475 480 505 500 485 490 500 505 The green line on the following graph shows the economy's long-term growth trend Use the blue points (circle symbol) to plot the real...
Please answer all fill in the blanks, thanks! In the United States, tire tread depth is...
 Please answer all fill in the blanks, thanks!
In the United States, tire tread depth is measured in 32nds of an inch. Car tires typically start out with 10/32 to 11/32 of an inch of tread depth. In most states, a tire is legally worn out when its tread depth reaches 2/32 of an inch. A random sample of four tires provides the following data on mileage and tread depth: Mileage (10,000 miles) Tread Depth (32nds of an inch) Tire...
Please answer all fill in the blanks, thanks!
In the United States, tire tread depth is measured in 32nds of an inch. Car tires typically start out with 10/32 to 11/32 of an inch of tread depth. In most states, a tire is legally worn out when its tread depth reaches 2/32 of an inch. A random sample of four tires provides the following data on mileage and tread depth: Mileage (10,000 miles) Tread Depth (32nds of an inch) Tire...
Please box answers! Thank you. 11. Monetary policy and the LM curve Aa Aa The following graph shows the demand and supply of real money balances in a hypothetical economy. Use the black point (X point...
 Please box answers! Thank
you.
11. Monetary policy and the LM curve Aa Aa The following graph shows the demand and supply of real money balances in a hypothetical economy. Use the black point (X point) to indicate the equilibrium in this market. Dashed drop lines will automatically extend to both axes. REAL INTEREST RATE [Percent) 10 Equilibrium Supply New Supply New Equilibrium Demand 3 0 10 20 30 40 50 60 70 80 90 100 REAL MONEY BALANCES Help...
Please box answers! Thank
you.
11. Monetary policy and the LM curve Aa Aa The following graph shows the demand and supply of real money balances in a hypothetical economy. Use the black point (X point) to indicate the equilibrium in this market. Dashed drop lines will automatically extend to both axes. REAL INTEREST RATE [Percent) 10 Equilibrium Supply New Supply New Equilibrium Demand 3 0 10 20 30 40 50 60 70 80 90 100 REAL MONEY BALANCES Help...
Answer the questions using the data and graph. please show all work. Thank you Titration of...
 Answer the questions using the data and graph. please show all
work. Thank you
Titration of Hydrochloric Acid: 1) Use the buret that is located near the hydrochloric acid container to dispense 25.00 mL of hydrochloric acid solution into a clean dry 100 mL beaker. Record the molarity of this solution on your data sheet. 2) Check to make sure that the volume on your sodium hydroxide buret reads 0.00 mL. If it does not read 0.00 mL, adjust it...
Answer the questions using the data and graph. please show all
work. Thank you
Titration of Hydrochloric Acid: 1) Use the buret that is located near the hydrochloric acid container to dispense 25.00 mL of hydrochloric acid solution into a clean dry 100 mL beaker. Record the molarity of this solution on your data sheet. 2) Check to make sure that the volume on your sodium hydroxide buret reads 0.00 mL. If it does not read 0.00 mL, adjust it...
 Using Aplia graphs Some questions will ask you to interpret a given graph, and others will require you to manipulate the objects on the graph or even add new required objects. Each manipulable object will be shown in the area to the right of the graph (the palette) and referred to by its color, object type, and shape of the control points, for example, black point (plus symbol). To place an object on the graph, select it from the palette...
 6. The graphs tool Using Aplia graphs Some questions will ask you to interpret a given graph, and others will require you to manipulate the objects on the graph or even add new required objects. Each manipulable object wil be shown in the area to the right of the graph (the palet the control points, for example, black point (plus symbol). To piace an object on the graph, select it from the palette and drag it onto the graph itself....
 Working with lines As with individual points, the control points that define a line can be placed only on the snap points of the graph. Often (though not always), snap points coincide with the intersection of grid lines. You are graded on the position of the line itself, not the position of the control points along the line. On the following graph, place the green line (triangle symbol) directly on top of the upward-sioping line you are given. Hint: Make...
 10. The shifter tool Another manipulable graph object The shifter tool is designed to let you answer questions by shifting entire lines or points along a line (or both) from one position to another. You can select any part of the line and drag it to the left or to the right. Once you have moved the point or line far enough, it will snap into one of a few possible positions. Shift the blue demand line (labeled D) to...
 The endpoint mover Manipulating objects already on the graph Some graphs will allow you to manipulate the endpoints of given lines or curves. When you select an endpoint mover line, the endpoints will appear empty white points that can be selected and moved to one of three prespecified snap points (including the original position). How do I know whether a line on a graph is movable? All endpoint mover objects will be accompanied by a greyed-out, labeled symbol on the...
 We were unable to transcribe this imageWorking with curves Each curve that you place on the graph will have at least three control points connected by a curved line. Rather than dragging each point onto the graph from the palette individually (as with connected points), you must drag the entire object onto the graph as a single unit. You can then change the shape by selecting and dragging one of the control points, or you can move the entire curve...
 Please clearly label
the graphs and show all the work. Thank you :)
2. Economic fluctuations and growth The following table shows data on a hypothetical country's real GDP from 1980 through 1988: Year 1980 1981 1982 1983 1984 1985 1986 1987 1988 Real GDP (Billions of Dollars) 465 475 480 505 500 485 490 500 505 The green line on the following graph shows the economy's long-term growth trend Use the blue points (circle symbol) to plot the real...
Please clearly label
the graphs and show all the work. Thank you :)
2. Economic fluctuations and growth The following table shows data on a hypothetical country's real GDP from 1980 through 1988: Year 1980 1981 1982 1983 1984 1985 1986 1987 1988 Real GDP (Billions of Dollars) 465 475 480 505 500 485 490 500 505 The green line on the following graph shows the economy's long-term growth trend Use the blue points (circle symbol) to plot the real...
 Please answer all fill in the blanks, thanks!
In the United States, tire tread depth is measured in 32nds of an inch. Car tires typically start out with 10/32 to 11/32 of an inch of tread depth. In most states, a tire is legally worn out when its tread depth reaches 2/32 of an inch. A random sample of four tires provides the following data on mileage and tread depth: Mileage (10,000 miles) Tread Depth (32nds of an inch) Tire...
Please answer all fill in the blanks, thanks!
In the United States, tire tread depth is measured in 32nds of an inch. Car tires typically start out with 10/32 to 11/32 of an inch of tread depth. In most states, a tire is legally worn out when its tread depth reaches 2/32 of an inch. A random sample of four tires provides the following data on mileage and tread depth: Mileage (10,000 miles) Tread Depth (32nds of an inch) Tire...
 Please box answers! Thank
you.
11. Monetary policy and the LM curve Aa Aa The following graph shows the demand and supply of real money balances in a hypothetical economy. Use the black point (X point) to indicate the equilibrium in this market. Dashed drop lines will automatically extend to both axes. REAL INTEREST RATE [Percent) 10 Equilibrium Supply New Supply New Equilibrium Demand 3 0 10 20 30 40 50 60 70 80 90 100 REAL MONEY BALANCES Help...
Please box answers! Thank
you.
11. Monetary policy and the LM curve Aa Aa The following graph shows the demand and supply of real money balances in a hypothetical economy. Use the black point (X point) to indicate the equilibrium in this market. Dashed drop lines will automatically extend to both axes. REAL INTEREST RATE [Percent) 10 Equilibrium Supply New Supply New Equilibrium Demand 3 0 10 20 30 40 50 60 70 80 90 100 REAL MONEY BALANCES Help...
 Answer the questions using the data and graph. please show all
work. Thank you
Titration of Hydrochloric Acid: 1) Use the buret that is located near the hydrochloric acid container to dispense 25.00 mL of hydrochloric acid solution into a clean dry 100 mL beaker. Record the molarity of this solution on your data sheet. 2) Check to make sure that the volume on your sodium hydroxide buret reads 0.00 mL. If it does not read 0.00 mL, adjust it...
Answer the questions using the data and graph. please show all
work. Thank you
Titration of Hydrochloric Acid: 1) Use the buret that is located near the hydrochloric acid container to dispense 25.00 mL of hydrochloric acid solution into a clean dry 100 mL beaker. Record the molarity of this solution on your data sheet. 2) Check to make sure that the volume on your sodium hydroxide buret reads 0.00 mL. If it does not read 0.00 mL, adjust it...
Most questions answered within 3 hours.
-
The company would like to buy a machine for 25 mil. USD. Machine
would be depreciated...
asked 21 seconds from now -
simplify the following boolean expression using boolean
identities(A' means NOT A):
X=(AB'C')+(AB'C)+(ABC)
asked 24 minutes ago -
2. What is the structure of tricaprylmethylammonium chloride?
What property or properties allow it to act...
asked 25 minutes ago -
A sample of 24 observations is selected from a normal population
where the sample standard deviation...
asked 38 minutes ago -
How social media will be used in education in 2030?? Actually i
am working on an...
asked 40 minutes ago -
Using Horner's scheme, represent (evaluate) the 2's complement
number 10011101 in decimal.
CAUTION: You will earn...
asked 41 minutes ago -
The vapor pressure of ethanol at 34.7 degrees Celsius is
100mmHg, and Hvap= 38.6 kJ/mol. What...
asked 43 minutes ago -
#3
Given the following hypotheses:
H0: μ = 520
H1: μ ≠ 520
A random sample...
asked 57 minutes ago -
You have been given a stipend to expand your “troubleshooting
tool kit” by adding three additional...
asked 52 minutes ago -
A machine costs P320,000 with a scrap value of 10% of the
original price at the...
asked 54 minutes ago -
Suppose that you have a reflection diffraction grating with n=
140 lines per millimeter. Light from...
asked 57 minutes ago -
A physician at a large clinic sees clients of all ages: babies
(<2 years old, event...
asked 1 hour ago