Consider the following set of data on the performance rating of an employee in an organization. The rating is ranging from 0 to 4. 0 - very poor 1 - poor 2 - average 3 - Excellent 4 - Outstanding . 1....
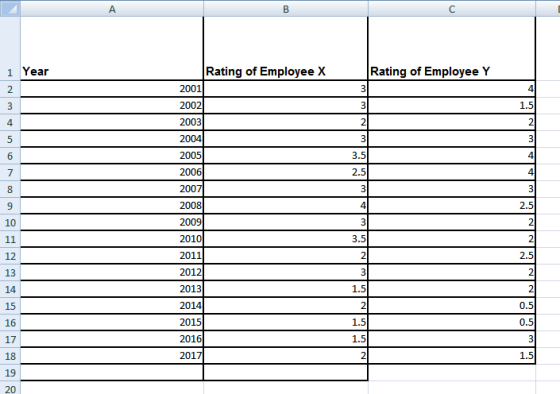
Consider the following set of data on the performance rating of an employee in an organization. The rating is ranging from 0 to 4.
0 - very poor
1 - poor
2 - average
3 - Excellent
4 - Outstanding .
1. Analyze the given data and rank them based on their performance. And give reasons.
2. Analyzing their performance between 2011 and 2017, what can you decide about their performance?
3. If the results of 1 and 2 are different, Explain why.
| Year | Rating of Employee X | Rating of Employee Y |
| 2001 | 3 | 4 |
| 2002 | 3 | 1.5 |
| 2003 | 2 | 2 |
| 2004 | 3 | 3 |
| 2005 | 3.5 | 4 |
| 2006 | 2.5 | 4 |
| 2007 | 3 | 3 |
| 2008 | 4 | 2.5 |
| 2009 | 3 | 2 |
| 2010 | 3.5 | 2 |
| 2011 | 2 | 2.5 |
| 2012 | 3 | 2 |
| 2013 | 1.5 | 2 |
| 2014 | 2 | 0.5 |
| 2015 | 1.5 | 0.5 |
| 2016 | 1.5 | 3 |
| 2017 | 2 | 1.5 |
Homework Answers
1)
 We have given ranking to the
employees based on their performance by using the CoV process.
We have given ranking to the
employees based on their performance by using the CoV process.
2)


As it is clearly visible in the above plots that the performance of both the employees has been decreased as the timespan increases.But performance of Y decreases much faster than X(trend shows this)
3) There's not much difference in the above two analysis both of them shows that the performance of X is better than the Y.
Add Answer to:
Consider the following set of data on the performance rating of an employee in an organization. The rating is ranging from 0 to 4. 0 - very poor 1 - poor 2 - average 3 - Excellent 4 - Outstanding . 1....
7.9 3.3 2. Consider the following data from 2001 - 2017, column 1 is the year,...
 7.9 3.3 2. Consider the following data from 2001 - 2017, column 1 is the year, the 2nd column is the unemployment rate, and the 3rd column is the inflation rate. Plot the data using a scatter plot and argue whether in your opinion, the Phillips Curve has validity. 2001 5.7 1.6 2002 6.0 2.4 2003 5.7 2004 2005 2006 2007 2008 2009 2010 2011 2012 2013 2014 2015 2016 2017 4.1 3.0 0.7
1. You are given the following time-series of precipitation data for Dubai. Using the Moving Windows...
 1. You are given the following time-series of precipitation data for Dubai. Using the Moving Windows technique: (a) First plot your data. (b) Use overlapping 5-year windows, with the windows having 3 common years (for example if the first window is years 2000, 2001, 2002, 2003, 2004 then the second window is years 2002, 2003, 2004, 2005, 2006) and plot the 5-year moving averages. (c) Explain any pattern that you see. (d) Calculate the average of the series that is...
Consider the following data: Year Deaths 2000 17057 Number of Deaths in the U.S. by Drug...
 Consider the following data: Year Deaths 2000 17057 Number of Deaths in the U.S. by Drug Overdose 2001 2002 2003 2004 2005 2006 17611 14314 13372 17763 14546 11157 2007 18656 2008 16613 Step 1 of 2. Find the two-period moving average for your 2008. If necessary, round to one more deomal place than the art number of doomd Answer points Year Deaths 2008 Number of Deaths in the U.S. by Drug Overdose 2001 2002 2003 2004 2005 2006 17611...
Using the data in the table a. What was the average annual return of Microsoft stock...
 Using the data in the table a. What was the average annual return of Microsoft stock from 2002-2014? b. What was the annual volatility for Microsoft stock from 2002-2014? Data Table Realized Return for the S&P 500, Microsoft, and Treasury Bills, 2002-2014 Microsoft S&P 500 Dividends S&P 500 Realized 1-Month Realized Return T-Bill Return Year End Index Paid* Return 2001 1148.08 - 22.1% 2002 879.82 14.53 22.0% 1.6% 2003 1111.92 20.80 28.7% 6.8% 1.0% 2004 20.98 10.9% 8.9% 1211.92 1.2%...
Year Period (t) Enrollment (1000s) 2001 1 6.5 2002 2 8.1 2003 3 8.4 2004 4...
Year Period (t) Enrollment (1000s) 2001 1 6.5 2002 2 8.1 2003 3 8.4 2004 4 10.2 2005 5 12.5 2006 6 13.3 2007 7 13.7 2008 8 17.2 2009 9 18.1 a. The data shows the enrollment for the college for the nine most recent years. Construct a time-series plot. What type of pattern exists in the data? b. Use simple linear regression analysis to find the parameters for the line that minimizes MSE for this time series. (using Period...
The data set on the right contains the real per capita GDP for 2 countries from the Penn World Table (PWT) version 9.1 (Feenstra et al., 2015). The column names are the country codes, OMN and PSE. You may copy the dataset to Excel or R to do the computati
 YearOMN197011266197176221972632319735051197473381975802219768360197793611978965919791092719801149919811280319821276619831242319841306419851403219861019219871005419888809198992381990105911991991819921026319931004519949747199510199199611054199711784199811560199913501200016173200116853200218508200320329200425768200526647200638458200740960200847136200938538201040305201144477201247334201344979201440855201532460201629939201728249
(1). Calculate the gross annual return on this stock and report the number in a separate...
 (1). Calculate the gross
annual return on this stock and report the number in a separate
column.
(2). Calculate the sample mean for the gross return.
(3). Calculate the sample standard deviation for the gross
return.
(4). Assume the risk-free rate is 0.02. Estimate the risk
premium.
(5). Estimate the sharp ratio.
Date Price before Dividend Dividend 2000 2001 2002 2003 2004 2005 2006 2007 2008 2009 2010 2011 2012 2013 2014 2015 742.5 758.8 742.9 697.7 744.9 693 735.7...
(1). Calculate the gross
annual return on this stock and report the number in a separate
column.
(2). Calculate the sample mean for the gross return.
(3). Calculate the sample standard deviation for the gross
return.
(4). Assume the risk-free rate is 0.02. Estimate the risk
premium.
(5). Estimate the sharp ratio.
Date Price before Dividend Dividend 2000 2001 2002 2003 2004 2005 2006 2007 2008 2009 2010 2011 2012 2013 2014 2015 742.5 758.8 742.9 697.7 744.9 693 735.7...
ha EXERCISE 8.5 THE MARKET FOR QUINOA LINK] ons Consider again the market for quinoa. The...
 ha EXERCISE 8.5 THE MARKET FOR QUINOA LINK] ons Consider again the market for quinoa. The changes shown in Figures 8.10a-c can be tch analysed as shifts in demand and supply. pric 1. Suppose there was an unexpected increase in demand for quinoa in the early 2000s ren shift in the demand curve). What would you expect to happen to the price and quant milli initially? 2. Assuming that demand continued to rise over the next few years, how do...
4. Use regression analysis in Excel to estimate the beta coefficient using the nominal interest rate...
4. Use regression analysis in Excel to estimate the beta coefficient using the nominal interest rate as the dependent variable and inflation rate as an independent variable during 1987-2017, and interpret the meaning of estimated equation and beta coefficient. Inflation Premium Rate Nominal Interest Rate Year 3.7 9.38 1987 4.1 9.71 1988 4.8 9.26 1989 5.4 9.32 1990 4.2 8.77 1991 3 8.14 1992 3 7.22 1993 2.6 7.97 1994 2.8 7.59 1995 2.9 7.37 1996 2.3 7.27 1997 1.6...
The general fund budget for a state for 1988 (Period 1) to 2011 (Period 24) follows....
 The general fund budget for a state for 1988 (Period 1) to 2011 (Period 24) follows. vau AWN Year Period Budget ($billions) 1988 1 3.05 1989 3.29 1990 3 3.56 1991 4.31 1992 4.39 1993 4.54 1994 4.66 1995 5.19 1996 5.35 1997 5.69 1998 6.01 1999 12 2000 6.48 2001 6.65 2002 15 6.56 2003 6.78 2004 6.98 2005 18 2006 8.38 2007 8.57 2008 21 8.66 2009 8.43 2010 23 8.23 2011 24 8.76 6.2 7.65 a. Which...
 7.9 3.3 2. Consider the following data from 2001 - 2017, column 1 is the year, the 2nd column is the unemployment rate, and the 3rd column is the inflation rate. Plot the data using a scatter plot and argue whether in your opinion, the Phillips Curve has validity. 2001 5.7 1.6 2002 6.0 2.4 2003 5.7 2004 2005 2006 2007 2008 2009 2010 2011 2012 2013 2014 2015 2016 2017 4.1 3.0 0.7
 1. You are given the following time-series of precipitation data for Dubai. Using the Moving Windows technique: (a) First plot your data. (b) Use overlapping 5-year windows, with the windows having 3 common years (for example if the first window is years 2000, 2001, 2002, 2003, 2004 then the second window is years 2002, 2003, 2004, 2005, 2006) and plot the 5-year moving averages. (c) Explain any pattern that you see. (d) Calculate the average of the series that is...
 Consider the following data: Year Deaths 2000 17057 Number of Deaths in the U.S. by Drug Overdose 2001 2002 2003 2004 2005 2006 17611 14314 13372 17763 14546 11157 2007 18656 2008 16613 Step 1 of 2. Find the two-period moving average for your 2008. If necessary, round to one more deomal place than the art number of doomd Answer points Year Deaths 2008 Number of Deaths in the U.S. by Drug Overdose 2001 2002 2003 2004 2005 2006 17611...
 Using the data in the table a. What was the average annual return of Microsoft stock from 2002-2014? b. What was the annual volatility for Microsoft stock from 2002-2014? Data Table Realized Return for the S&P 500, Microsoft, and Treasury Bills, 2002-2014 Microsoft S&P 500 Dividends S&P 500 Realized 1-Month Realized Return T-Bill Return Year End Index Paid* Return 2001 1148.08 - 22.1% 2002 879.82 14.53 22.0% 1.6% 2003 1111.92 20.80 28.7% 6.8% 1.0% 2004 20.98 10.9% 8.9% 1211.92 1.2%...
 (1). Calculate the gross
annual return on this stock and report the number in a separate
column.
(2). Calculate the sample mean for the gross return.
(3). Calculate the sample standard deviation for the gross
return.
(4). Assume the risk-free rate is 0.02. Estimate the risk
premium.
(5). Estimate the sharp ratio.
Date Price before Dividend Dividend 2000 2001 2002 2003 2004 2005 2006 2007 2008 2009 2010 2011 2012 2013 2014 2015 742.5 758.8 742.9 697.7 744.9 693 735.7...
(1). Calculate the gross
annual return on this stock and report the number in a separate
column.
(2). Calculate the sample mean for the gross return.
(3). Calculate the sample standard deviation for the gross
return.
(4). Assume the risk-free rate is 0.02. Estimate the risk
premium.
(5). Estimate the sharp ratio.
Date Price before Dividend Dividend 2000 2001 2002 2003 2004 2005 2006 2007 2008 2009 2010 2011 2012 2013 2014 2015 742.5 758.8 742.9 697.7 744.9 693 735.7...
 ha EXERCISE 8.5 THE MARKET FOR QUINOA LINK] ons Consider again the market for quinoa. The changes shown in Figures 8.10a-c can be tch analysed as shifts in demand and supply. pric 1. Suppose there was an unexpected increase in demand for quinoa in the early 2000s ren shift in the demand curve). What would you expect to happen to the price and quant milli initially? 2. Assuming that demand continued to rise over the next few years, how do...
 The general fund budget for a state for 1988 (Period 1) to 2011 (Period 24) follows. vau AWN Year Period Budget ($billions) 1988 1 3.05 1989 3.29 1990 3 3.56 1991 4.31 1992 4.39 1993 4.54 1994 4.66 1995 5.19 1996 5.35 1997 5.69 1998 6.01 1999 12 2000 6.48 2001 6.65 2002 15 6.56 2003 6.78 2004 6.98 2005 18 2006 8.38 2007 8.57 2008 21 8.66 2009 8.43 2010 23 8.23 2011 24 8.76 6.2 7.65 a. Which...
Most questions answered within 3 hours.
-
For the following reaction, 0.128 moles of
potassium hydrogen sulfateare mixed with
0.504 moles of potassium...
asked 1 hour ago -
1. What is the present value of $400, three years in the future
if the interest...
asked 2 hours ago -
The labor force minus the number of employed equals the number
of unemployed.
a. True
b....
asked 4 hours ago -
Determine the mass in units of grams [g] of 0.49 moles [mol]
of a new fictitious...
asked 4 hours ago -
A horizontal mass of M=5kg is on a spring and stretched to
x=0.5m when released from...
asked 5 hours ago -
26 of 50
"I have worked at the Arizona Humane Society for ten years, and
have...
asked 6 hours ago -
Compare and contrast zero based budgeting and incremental (or
base year) budgeting.
asked 6 hours ago -
4 pts 10. Which of the following hypothesis would be MOST
difficult to test experimentally? Group...
asked 6 hours ago -
A business owner makes 1,000 items a day. Each day he or she
contributes eight hours...
asked 6 hours ago -
A
circular loop in the plane of a paper lies inca0.65 T magnetic
field pointing into...
asked 6 hours ago -
A business owner is trying to decide whether to buy, rent, or
lease office space and...
asked 6 hours ago -
Thermal Storage Solar heating of a house is much more efficient
if there is a way...
asked 6 hours ago