Calculate the times interest earned ratio from 2015 to 2018 and interpret them. ASX Code Item 06/15 06/16 06/17 06/18 TLS Operating Revenue 25,845,000,000.00 25,834,000,000.00 25,912,0...
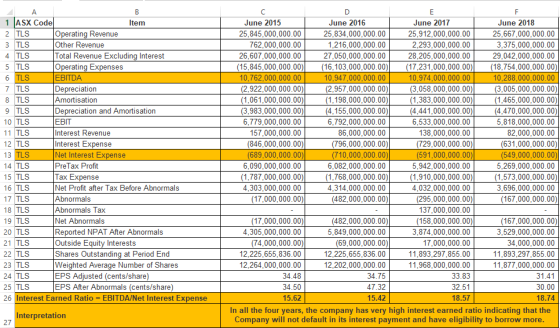
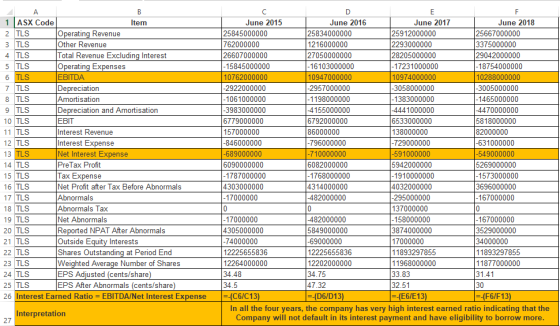
Calculate the times interest earned ratio from 2015 to 2018 and interpret them.
| ASX Code | Item | 06/15 | 06/16 | 06/17 | 06/18 |
| TLS | Operating Revenue | 25,845,000,000.00 | 25,834,000,000.00 | 25,912,000,000.00 | 25,667,000,000.00 |
| TLS | Other Revenue | 762,000,000.00 | 1,216,000,000.00 | 2,293,000,000.00 | 3,375,000,000.00 |
| TLS | Total Revenue Excluding Interest | 26,607,000,000.00 | 27,050,000,000.00 | 28,205,000,000.00 | 29,042,000,000.00 |
| TLS | Operating Expenses | -15,845,000,000.00 | -16,103,000,000.00 | -17,231,000,000.00 | -18,754,000,000.00 |
| TLS | EBITDA | 10,762,000,000.00 | 10,947,000,000.00 | 10,974,000,000.00 | 10,288,000,000.00 |
| TLS | Depreciation | -2,922,000,000.00 | -2,957,000,000.00 | -3,058,000,000.00 | -3,005,000,000.00 |
| TLS | Amortisation | -1,061,000,000.00 | -1,198,000,000.00 | -1,383,000,000.00 | -1,465,000,000.00 |
| TLS | Depreciation and Amortisation | -3,983,000,000.00 | -4,155,000,000.00 | -4,441,000,000.00 | -4,470,000,000.00 |
| TLS | EBIT | 6,779,000,000.00 | 6,792,000,000.00 | 6,533,000,000.00 | 5,818,000,000.00 |
| TLS | Interest Revenue | 157,000,000.00 | 86,000,000.00 | 138,000,000.00 | 82,000,000.00 |
| TLS | Interest Expense | -846,000,000.00 | -796,000,000.00 | -729,000,000.00 | -631,000,000.00 |
| TLS | Net Interest Expense | -689,000,000.00 | -710,000,000.00 | -591,000,000.00 | -549,000,000.00 |
| TLS | PreTax Profit | 6,090,000,000.00 | 6,082,000,000.00 | 5,942,000,000.00 | 5,269,000,000.00 |
| TLS | Tax Expense | -1,787,000,000.00 | -1,768,000,000.00 | -1,910,000,000.00 | -1,573,000,000.00 |
| TLS | Net Profit after Tax Before Abnormals | 4,303,000,000.00 | 4,314,000,000.00 | 4,032,000,000.00 | 3,696,000,000.00 |
| TLS | Abnormals | -17,000,000.00 | -482,000,000.00 | -295,000,000.00 | -167,000,000.00 |
| TLS | Abnormals Tax | 0.00 | 0.00 | 137,000,000.00 | 0.00 |
| TLS | Net Abnormals | -17,000,000.00 | -482,000,000.00 | -158,000,000.00 | -167,000,000.00 |
| TLS | Reported NPAT After Abnormals | 4,305,000,000.00 | 5,849,000,000.00 | 3,874,000,000.00 | 3,529,000,000.00 |
| TLS | Outside Equity Interests | -74,000,000.00 | -69,000,000.00 | 17,000,000.00 | 34,000,000.00 |
| TLS | Shares Outstanding at Period End | 12,225,655,836.00 | 12,225,655,836.00 | 11,893,297,855.00 | 11,893,297,855.00 |
| TLS | Weighted Average Number of Shares | 12,264,000,000.00 | 12,202,000,000.00 | 11,968,000,000.00 | 11,877,000,000.00 |
| TLS | EPS Adjusted (cents/share) | 34.48 | 34.75 | 33.83 | 31.41 |
| TLS | EPS After Abnormals (cents/share) | 34.50 | 47.32 | 32.51 | 30.00 |
Homework Answers
Add Answer to:
Calculate the times interest earned ratio from 2015 to 2018 and interpret them. ASX Code Item 06/15 06/16 06/17 06/18 TLS Operating Revenue 25,845,000,000.00 25,834,000,000.00 25,912,0...
the question is Write a brief report, using the horizontal analysis data, individually analysing the Profit...
 the question is
Write a brief report, using the horizontal analysis
data, individually analysing the Profit and Loss, Balance Sheet and
Cash Flow Statement. It is not acceptable to simply state one
number is bigger than the other and therefore it is better. You
need to explain the importance of the number and why it is
better/worse
NOTE: I need it to be 200
words only for all of them together not
separately and It is not acceptable to simply...
the question is
Write a brief report, using the horizontal analysis
data, individually analysing the Profit and Loss, Balance Sheet and
Cash Flow Statement. It is not acceptable to simply state one
number is bigger than the other and therefore it is better. You
need to explain the importance of the number and why it is
better/worse
NOTE: I need it to be 200
words only for all of them together not
separately and It is not acceptable to simply...
I need someone to calculate the 2019 current ratio, quick ratio, times interest earned ratio, and...
 I need someone to calculate the 2019 current ratio, quick ratio,
times interest earned ratio, and return on stockholders equity with
the 2 statements i have screenshotted.
WP A.7 WHEELS-4-U CORPORATION CONSOLIDATED BALANCE SHEETS ($000 except share data) 12/31/20x9 12/31/20x8 ASSETS Current Assets: Cash and cash equivalents Accounts and other receivables, net Inventories Deferred income tax assets Prepaid expenses Total current assets Property, plant, and Equipment, at cost: Land and land improvements Buildings and building improvements Machinery and equipment Office...
I need someone to calculate the 2019 current ratio, quick ratio,
times interest earned ratio, and return on stockholders equity with
the 2 statements i have screenshotted.
WP A.7 WHEELS-4-U CORPORATION CONSOLIDATED BALANCE SHEETS ($000 except share data) 12/31/20x9 12/31/20x8 ASSETS Current Assets: Cash and cash equivalents Accounts and other receivables, net Inventories Deferred income tax assets Prepaid expenses Total current assets Property, plant, and Equipment, at cost: Land and land improvements Buildings and building improvements Machinery and equipment Office...
 the question is
Write a brief report, using the horizontal analysis
data, individually analysing the Profit and Loss, Balance Sheet and
Cash Flow Statement. It is not acceptable to simply state one
number is bigger than the other and therefore it is better. You
need to explain the importance of the number and why it is
better/worse
NOTE: I need it to be 200
words only for all of them together not
separately and It is not acceptable to simply...
the question is
Write a brief report, using the horizontal analysis
data, individually analysing the Profit and Loss, Balance Sheet and
Cash Flow Statement. It is not acceptable to simply state one
number is bigger than the other and therefore it is better. You
need to explain the importance of the number and why it is
better/worse
NOTE: I need it to be 200
words only for all of them together not
separately and It is not acceptable to simply...
 I need someone to calculate the 2019 current ratio, quick ratio,
times interest earned ratio, and return on stockholders equity with
the 2 statements i have screenshotted.
WP A.7 WHEELS-4-U CORPORATION CONSOLIDATED BALANCE SHEETS ($000 except share data) 12/31/20x9 12/31/20x8 ASSETS Current Assets: Cash and cash equivalents Accounts and other receivables, net Inventories Deferred income tax assets Prepaid expenses Total current assets Property, plant, and Equipment, at cost: Land and land improvements Buildings and building improvements Machinery and equipment Office...
I need someone to calculate the 2019 current ratio, quick ratio,
times interest earned ratio, and return on stockholders equity with
the 2 statements i have screenshotted.
WP A.7 WHEELS-4-U CORPORATION CONSOLIDATED BALANCE SHEETS ($000 except share data) 12/31/20x9 12/31/20x8 ASSETS Current Assets: Cash and cash equivalents Accounts and other receivables, net Inventories Deferred income tax assets Prepaid expenses Total current assets Property, plant, and Equipment, at cost: Land and land improvements Buildings and building improvements Machinery and equipment Office...
Most questions answered within 3 hours.
-
Write a program to solve the Josephus problem, with the following
modification:
Sample Input:
./a.out n...
asked 1 hour ago -
At the start of a CD it is spinning at a rate of 525 rpm
(revolutions...
asked 1 hour ago -
4. Without doing any calculations, predict whether the observed
∆T would increase, decrease or remain the...
asked 2 hours ago -
Based on the range, which of the following sets of scores has
the greatest variability? 3,...
asked 4 hours ago -
Ripples in a pond travel at a velocity of 3 m/s with one peak
passing a...
asked 3 hours ago -
A man stands on the roof of a building of height 13.0 mm and
throws a...
asked 4 hours ago -
The extent to which assets are financed by borrowed funds and
other liabilities is indicated by:...
asked 5 hours ago -
Explain in detail
Germany is the fifth largest economy
explain what goods and services Germany specializes...
asked 5 hours ago -
The density of platinum is 21.45 g/mL. If a cube of platinum
with a mass of...
asked 5 hours ago -
Accounts Receivable
Sales
A/R Posting
Extended Sales Invoice
Packing Slip
Compare invoice to packing slip 2...
asked 5 hours ago -
Michaella, age 23, is a full-time law student and is claimed by
her parents as a...
asked 5 hours ago -
Why are polymers not typically casted into products?
asked 5 hours ago