MATLAB Fourier transform. Suppose that a signal x(t) is sampled
with sampling frequency fs =100Hz.
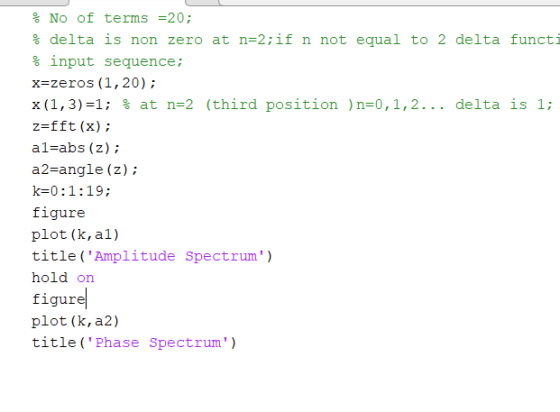
The sequence x[n] obtained after the sampling is given below:

Take the DFT of the sampled sequence and plot its magnitude and phase.
What is the frequency resolution (Δf) of your plot?
Homework Answers
1.The Frequency Resolution is given by 
Add Answer to:
MATLAB Fourier transform. Suppose that a signal x(t) is sampled with sampling frequency fs =100Hz. The sequence x[n] obtained after the sampling is given below: Take the DFT of the sampled sequence a...
10. Find the Fourier transform of a continuous-time signal x(t) = 10e Su(t). Plot the magnitude...
 10. Find the Fourier transform of a continuous-time signal x(t) = 10e Su(t). Plot the magnitude spectrum and the phase spectrum. If the signal is going to be sampled, what should be the minimum sampling frequency so that the aliasing error is less than 0.1 % of the maximum original magnitude at half the sampling frequency. 11. A signal x(t) = 5cos(2nt + 1/6) is sampled at every 0.2 seconds. Find the sequence obtained over the interval 0 st 3...
36. Sampling a low-pass signal. A signal x(t) = sin( 1,000.71) is sampled at the rate...
 36. Sampling a low-pass signal. A signal x(t) = sin( 1,000.71) is sampled at the rate of F, and sent through a unity-gain ideal low-pass filter with the cutoff frequency at F,/2. Find and plot the Fourier transform of the reconstructed signal z(t) at filter's output if a. F=20 kHz b. Fs =800 Hz
Consider a sampler which samples the continuous-time input signal x(t) at a sampling frequency fs =...
 Consider a sampler which samples the continuous-time input signal x(t) at a sampling frequency fs = 8000 Hz and produces at its output a sampled discrete-time signal x$(t) = x(nTs), where To = 1/fs is the sampling period. If the sampled signal is passed through a unity-gain lowpass filter with cutoff frequency of fs/2, sketch the magnitude spectrum of the resulting signal for the following input signals: (a) x(t) = cos(6000nt). (b) x(t) = cos(12000nt). (c) x(t) = cos(18000nt).
# 1 : Imagine that you have a continuous-time signal x(t) whose continuous-time Fourier transform is...
 # 1 : Imagine that you have a continuous-time signal x(t) whose continuous-time Fourier transform is as given below -25 -20 f, Hz -10 10 20 25 (a) (10 pts) Imagine that this signal is sampled at the sampling rate of F, 65 Hz. Sketch the FT of the resulting signal that would be at the output of an ideal DAC (like we discussed in class) when given these samples. (b) (10 pts) Repeat part (a) for the case that...
Consider the continuous time signal: 2. , π (sin (2t) (Sin (8t) A discrete time signal x[n] -xs(t) -x(nTs) is created by sampling x() with sampling interval, 2it 60 a) Plot the Fourier Transform of t...
 Consider the continuous time signal: 2. , π (sin (2t) (Sin (8t) A discrete time signal x[n] -xs(t) -x(nTs) is created by sampling x() with sampling interval, 2it 60 a) Plot the Fourier Transform of the sampled signal, i.e. Xs (jo). b) Plot the DTFT of the sampled signal, ie, X(eja) o) Repeat (a) with 7, 2π d) Repeat (b) with , 18
Consider the continuous time signal: 2. , π (sin (2t) (Sin (8t) A discrete time signal x[n]...
Consider the continuous time signal: 2. , π (sin (2t) (Sin (8t) A discrete time signal x[n] -xs(t) -x(nTs) is created by sampling x() with sampling interval, 2it 60 a) Plot the Fourier Transform of the sampled signal, i.e. Xs (jo). b) Plot the DTFT of the sampled signal, ie, X(eja) o) Repeat (a) with 7, 2π d) Repeat (b) with , 18
Consider the continuous time signal: 2. , π (sin (2t) (Sin (8t) A discrete time signal x[n]...
Exercise 4. Computing and displaying the Fourier Transform of a signal Later in the semester it will become useful to d...
 Exercise 4. Computing and displaying the Fourier Transform of a signal Later in the semester it will become useful to determine the frequency response of a signal or system by taking the Fourier Transform empirically (rather than computing it analytically). To do so we make use of the fft and fftshift commands. The fft command is an efficient implementation of the Discrete Fourier Transform (DFT) known as the Fast Fourier Transform (FFT). When the FFT is computed the samples are...
Problem 2 Consider a continuous-time signal x(t), of which the Fourier transform is ( 21f #...
 Problem 2 Consider a continuous-time signal x(t), of which the Fourier transform is ( 21f # (1)= 1° X(t)e=1218i dt = le 1000 15 1 400 lo otherwise Discrete-time signal x[n] is obtained by sampling x(t) at sampling at every 1 us -i.e., x[n] = xy(10ºn). (a) Write discrete-time Fourier transform of x[n], X (elo). (b) Plot the magnitude and phase response of X (ejm).
Let x(t) be the signal with Fourier transform Xjw) shown below x(j) Let Xs(t) be obtained...
 Let x(t) be the signal with Fourier transform Xjw) shown below x(j) Let Xs(t) be obtained by sampling x(t) with sampling period Td let xdin]- x(nT) for all integer n. Which option is the plot of Xd(e the Fourier transform of xdinj? Instructions: First sketchXs ω which is the Fourier transtorm of xs nt is going to be infinite number of replicas of Sketch on 3 e cas. You need to n he span between heep as he )and Xole...
Please provide a detailed answer, Thank you A Signal xt) with a Fourier Transform Rads/sec. X(92)...
 Please provide a detailed answer, Thank you
A Signal xt) with a Fourier Transform Rads/sec. X(92) shown below is sampled with sampling Frequency 100 X(02) -2020 20 brad/sec) a- Plot the Fourier Transform of the sampled signal X.(2) b- What is the Nyquist Frequency C- What is the minimum sample rate we can use? d- What filter we can use to reconstruct the signal and what is its impulse response. e- If we decide to sample the signal at 50...
Please provide a detailed answer, Thank you
A Signal xt) with a Fourier Transform Rads/sec. X(92) shown below is sampled with sampling Frequency 100 X(02) -2020 20 brad/sec) a- Plot the Fourier Transform of the sampled signal X.(2) b- What is the Nyquist Frequency C- What is the minimum sample rate we can use? d- What filter we can use to reconstruct the signal and what is its impulse response. e- If we decide to sample the signal at 50...
(5%) The following signals r t) is sanpled periodically to obtained the discrete-time signal [n. ...
 Please explain why. Thank you.
(5%) The following signals r t) is sanpled periodically to obtained the discrete-time signal [n. For each of the given sampling rates in F, Hz or in T period, (i) determine the spectrum x(eM) of x[n]; (ii) plot its magnitude and phase as a function of w in and as a function of sampling frequency Fs in HZ; and (iii explain whether e(t) can be recovered from rn] (a) re(t) 8 +12e-3207e-j0(+), with sampling rate...
Please explain why. Thank you.
(5%) The following signals r t) is sanpled periodically to obtained the discrete-time signal [n. For each of the given sampling rates in F, Hz or in T period, (i) determine the spectrum x(eM) of x[n]; (ii) plot its magnitude and phase as a function of w in and as a function of sampling frequency Fs in HZ; and (iii explain whether e(t) can be recovered from rn] (a) re(t) 8 +12e-3207e-j0(+), with sampling rate...
 10. Find the Fourier transform of a continuous-time signal x(t) = 10e Su(t). Plot the magnitude spectrum and the phase spectrum. If the signal is going to be sampled, what should be the minimum sampling frequency so that the aliasing error is less than 0.1 % of the maximum original magnitude at half the sampling frequency. 11. A signal x(t) = 5cos(2nt + 1/6) is sampled at every 0.2 seconds. Find the sequence obtained over the interval 0 st 3...
 36. Sampling a low-pass signal. A signal x(t) = sin( 1,000.71) is sampled at the rate of F, and sent through a unity-gain ideal low-pass filter with the cutoff frequency at F,/2. Find and plot the Fourier transform of the reconstructed signal z(t) at filter's output if a. F=20 kHz b. Fs =800 Hz
 Consider a sampler which samples the continuous-time input signal x(t) at a sampling frequency fs = 8000 Hz and produces at its output a sampled discrete-time signal x$(t) = x(nTs), where To = 1/fs is the sampling period. If the sampled signal is passed through a unity-gain lowpass filter with cutoff frequency of fs/2, sketch the magnitude spectrum of the resulting signal for the following input signals: (a) x(t) = cos(6000nt). (b) x(t) = cos(12000nt). (c) x(t) = cos(18000nt).
 # 1 : Imagine that you have a continuous-time signal x(t) whose continuous-time Fourier transform is as given below -25 -20 f, Hz -10 10 20 25 (a) (10 pts) Imagine that this signal is sampled at the sampling rate of F, 65 Hz. Sketch the FT of the resulting signal that would be at the output of an ideal DAC (like we discussed in class) when given these samples. (b) (10 pts) Repeat part (a) for the case that...
 Consider the continuous time signal: 2. , π (sin (2t) (Sin (8t) A discrete time signal x[n] -xs(t) -x(nTs) is created by sampling x() with sampling interval, 2it 60 a) Plot the Fourier Transform of the sampled signal, i.e. Xs (jo). b) Plot the DTFT of the sampled signal, ie, X(eja) o) Repeat (a) with 7, 2π d) Repeat (b) with , 18
Consider the continuous time signal: 2. , π (sin (2t) (Sin (8t) A discrete time signal x[n]...
Consider the continuous time signal: 2. , π (sin (2t) (Sin (8t) A discrete time signal x[n] -xs(t) -x(nTs) is created by sampling x() with sampling interval, 2it 60 a) Plot the Fourier Transform of the sampled signal, i.e. Xs (jo). b) Plot the DTFT of the sampled signal, ie, X(eja) o) Repeat (a) with 7, 2π d) Repeat (b) with , 18
Consider the continuous time signal: 2. , π (sin (2t) (Sin (8t) A discrete time signal x[n]...
 Exercise 4. Computing and displaying the Fourier Transform of a signal Later in the semester it will become useful to determine the frequency response of a signal or system by taking the Fourier Transform empirically (rather than computing it analytically). To do so we make use of the fft and fftshift commands. The fft command is an efficient implementation of the Discrete Fourier Transform (DFT) known as the Fast Fourier Transform (FFT). When the FFT is computed the samples are...
 Problem 2 Consider a continuous-time signal x(t), of which the Fourier transform is ( 21f # (1)= 1° X(t)e=1218i dt = le 1000 15 1 400 lo otherwise Discrete-time signal x[n] is obtained by sampling x(t) at sampling at every 1 us -i.e., x[n] = xy(10ºn). (a) Write discrete-time Fourier transform of x[n], X (elo). (b) Plot the magnitude and phase response of X (ejm).
 Let x(t) be the signal with Fourier transform Xjw) shown below x(j) Let Xs(t) be obtained by sampling x(t) with sampling period Td let xdin]- x(nT) for all integer n. Which option is the plot of Xd(e the Fourier transform of xdinj? Instructions: First sketchXs ω which is the Fourier transtorm of xs nt is going to be infinite number of replicas of Sketch on 3 e cas. You need to n he span between heep as he )and Xole...
 Please provide a detailed answer, Thank you
A Signal xt) with a Fourier Transform Rads/sec. X(92) shown below is sampled with sampling Frequency 100 X(02) -2020 20 brad/sec) a- Plot the Fourier Transform of the sampled signal X.(2) b- What is the Nyquist Frequency C- What is the minimum sample rate we can use? d- What filter we can use to reconstruct the signal and what is its impulse response. e- If we decide to sample the signal at 50...
Please provide a detailed answer, Thank you
A Signal xt) with a Fourier Transform Rads/sec. X(92) shown below is sampled with sampling Frequency 100 X(02) -2020 20 brad/sec) a- Plot the Fourier Transform of the sampled signal X.(2) b- What is the Nyquist Frequency C- What is the minimum sample rate we can use? d- What filter we can use to reconstruct the signal and what is its impulse response. e- If we decide to sample the signal at 50...
 Please explain why. Thank you.
(5%) The following signals r t) is sanpled periodically to obtained the discrete-time signal [n. For each of the given sampling rates in F, Hz or in T period, (i) determine the spectrum x(eM) of x[n]; (ii) plot its magnitude and phase as a function of w in and as a function of sampling frequency Fs in HZ; and (iii explain whether e(t) can be recovered from rn] (a) re(t) 8 +12e-3207e-j0(+), with sampling rate...
Please explain why. Thank you.
(5%) The following signals r t) is sanpled periodically to obtained the discrete-time signal [n. For each of the given sampling rates in F, Hz or in T period, (i) determine the spectrum x(eM) of x[n]; (ii) plot its magnitude and phase as a function of w in and as a function of sampling frequency Fs in HZ; and (iii explain whether e(t) can be recovered from rn] (a) re(t) 8 +12e-3207e-j0(+), with sampling rate...
Most questions answered within 3 hours.
-
Blossom Company owns 10000 of the 50000 outstanding shares of
Taylor, Inc. common stock. During 2018,...
asked 2 minutes from now -
Calculate the following: ***SHOW ALL WORK!!!! Or
NO CREDIT*** Circle your answers. 8pts
each
In the...
asked 1 hour ago -
Bank Z is currently advertising interest rates on its checking
account. They claim to pay an...
asked 1 hour ago -
List two ways of transformation on the response variable that
can be used to deal with...
asked 2 hours ago -
If a 2000 ohm resistor has a -3.90 mA current going through it.
What is the...
asked 2 hours ago -
Please comment on the sentences.
Some types of jobs require more training than others. Some
companies...
asked 3 hours ago -
The )G01 for the hydrolysis of phosphorarginine
reaction depicted below is –32 kJ mol-1.
Phosphoarginine ...
asked 3 hours ago -
Cross a heterozygous blue-eyed goat with a homozygous brown-eyed
goat. Be sure to indicate which kids...
asked 4 hours ago -
Use the following information to answer the next two
questions.
Please refer to question 9-90. A...
asked 4 hours ago -
A solution containing 0.050 g of an unknown electrolyte in 2.50
g of cyclohexane was found...
asked 4 hours ago -
Question 1
a) Hydraulic conductivity of soils is an important parameter for
the design of engineering...
asked 4 hours ago -
Suppose your credit card balance is
$15,000
The minimum payment is
$313
and the annual percentage...
asked 4 hours ago