
Homework Answers


Add Answer to:
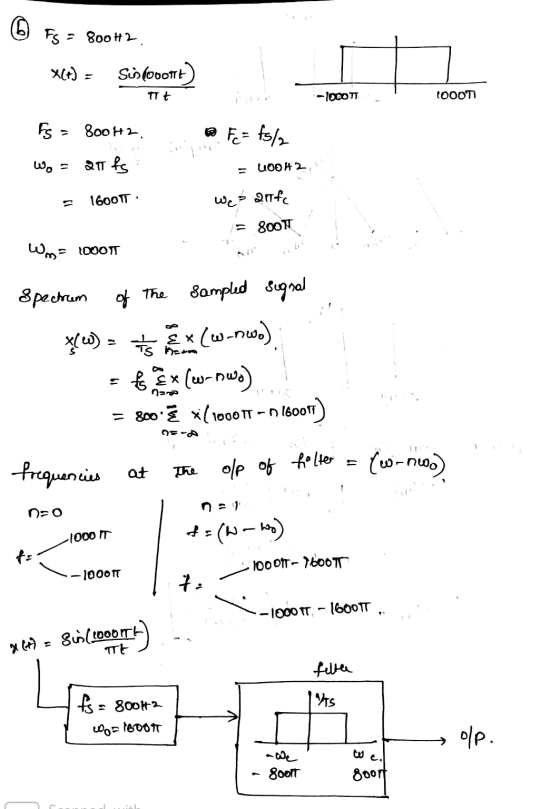
36. Sampling a low-pass signal. A signal x(t) = sin( 1,000.71) is sampled at the rate...
21. The signal x(t) = cos(1,8001t – 1/6) is sampled uniformly at the rate of 1...
 21. The signal x(t) = cos(1,8001t – 1/6) is sampled uniformly at the rate of 1 kHz and passed through an ideal low-pass filter with a DC gain of 0.001 and a cutoff frequency of 500 Hz. Find the filter's output.
Frequency multiplication. Sample x(t) = cos 3πt at the rate of 4 Hz and send impulse...
Frequency multiplication. Sample x(t) = cos 3πt at the rate of 4 Hz and send impulse samples through an ideal low-pass filter with the cutoff frequency at fc and gain = 1/4. Find and plot the Fourier transform of the reconstructed signal z(t) and its time expression for fc = 2, 3, 4, 5, 6 Hz.
3. (50 points] Consider the signal (t= cos(27 (100)+]: 1) Let's take samples of x(t) at...
 3. (50 points] Consider the signal (t= cos(27 (100)+]: 1) Let's take samples of x(t) at a sampling rate fs = 180 Hz. Sketch the spectrum X (f) of the sampled signal x (t). Properly label x-axis and y-axis. 2) Now suppose we will use an ideal lowpass filter of gain 1/fs with a cutoff frequency 90 Hz for the sampled signal xs(t). What is the output of the filter x,(t)? 3) Now let's take samples of x(t) at sampling...
Consider a sampler which samples the continuous-time input signal x(t) at a sampling frequency fs =...
 Consider a sampler which samples the continuous-time input signal x(t) at a sampling frequency fs = 8000 Hz and produces at its output a sampled discrete-time signal x$(t) = x(nTs), where To = 1/fs is the sampling period. If the sampled signal is passed through a unity-gain lowpass filter with cutoff frequency of fs/2, sketch the magnitude spectrum of the resulting signal for the following input signals: (a) x(t) = cos(6000nt). (b) x(t) = cos(12000nt). (c) x(t) = cos(18000nt).
MATLAB Fourier transform. Suppose that a signal x(t) is sampled with sampling frequency fs =100Hz. The sequence x[n] obtained after the sampling is given below: Take the DFT of the sampled sequence a...
 MATLAB Fourier transform. Suppose that a signal x(t) is sampled
with sampling frequency fs =100Hz.
The sequence x[n] obtained after the sampling is given below:
Take the DFT of the sampled sequence and plot
its magnitude and phase.
What is the frequency resolution (Δf) of your plot?
N= 20, 100 Hz
N= 20, 100 Hz
MATLAB Fourier transform. Suppose that a signal x(t) is sampled
with sampling frequency fs =100Hz.
The sequence x[n] obtained after the sampling is given below:
Take the DFT of the sampled sequence and plot
its magnitude and phase.
What is the frequency resolution (Δf) of your plot?
N= 20, 100 Hz
N= 20, 100 Hz
Q1) Given an analog signal X(t) = 3 cos (2π . 2000t) + 2 cos (2π...
Q1) Given an analog signal X(t) = 3 cos (2π . 2000t) + 2 cos (2π . 5500t) sampled at a rate of 10,000 Hz, a. Sketch the spectrum of the sampled signal up to 20 kHz; b. Sketch the recovered analog signal spectrum if an ideal lowpass filter with a cutoff frequency of 4 kHz is used to filter the sampled signal in order to recover the original signal ; c. Determine the frequency/frequencies of aliasing noise . Q2)...
1. (50pt) NOTE: To get full mark, you are required to: (1) Plot sampled signals and...
 1. (50pt) NOTE: To get full mark, you are required to: (1) Plot sampled signals and fitered signals in the frequency domain, (e) Provide solution in time domain and (3 Provide the reasoning. HINT: Take notice on the height of the low pass filter for correct solutions A signal r(t)-cos(3rt) is sampled at a rate of f, samples per second. The sampled signal is then passed through an ideal low pass filter (LPF) with a cutoff frequency at 2 Hz...
Q. 2 A continuous time signal x(t) has the Continuous Time Fourier Transform shown in Fig...
 Q. 2 A continuous time signal x(t) has the Continuous Time Fourier Transform shown in Fig 2. Xc() -80007 0 80001 2 (rad/s) Fig 2 According to the sampling theorem, find the maximum allowable sampling period T for this signal. Also plot the Fourier Transforms of the sampled signal X:(j) and X(elo). Label the resulting signals appropriately (both in frequency and amplitude axis). Assuming that the sampling period is increased 1.2 times, what is the new sampling frequency 2? What...
Using the windowing functions discussed in class, design a low-pass FIR filter with a cutoff freq...
 Using the windowing functions discussed in class, design a
low-pass FIR filter with a cutoff frequency of 2 kHz, a minimum
stop band attenuation of 40 dB, and a transition width of 200Hz.
The sampling frequency is 10kHz.
1. Using the windowing functions discussed in class, design a low-pass FIR filter with a cutoff frequency of 2 kHz, a minimum stop band attenuation of 40 dB, and a transition width of 200 Hz. The sampling frequency is 10 kHz 2....
Using the windowing functions discussed in class, design a
low-pass FIR filter with a cutoff frequency of 2 kHz, a minimum
stop band attenuation of 40 dB, and a transition width of 200Hz.
The sampling frequency is 10kHz.
1. Using the windowing functions discussed in class, design a low-pass FIR filter with a cutoff frequency of 2 kHz, a minimum stop band attenuation of 40 dB, and a transition width of 200 Hz. The sampling frequency is 10 kHz 2....
Consider the continuous time signal: 2. , π (sin (2t) (Sin (8t) A discrete time signal x[n] -xs(t) -x(nTs) is created by sampling x() with sampling interval, 2it 60 a) Plot the Fourier Transform of t...
 Consider the continuous time signal: 2. , π (sin (2t) (Sin (8t) A discrete time signal x[n] -xs(t) -x(nTs) is created by sampling x() with sampling interval, 2it 60 a) Plot the Fourier Transform of the sampled signal, i.e. Xs (jo). b) Plot the DTFT of the sampled signal, ie, X(eja) o) Repeat (a) with 7, 2π d) Repeat (b) with , 18
Consider the continuous time signal: 2. , π (sin (2t) (Sin (8t) A discrete time signal x[n]...
Consider the continuous time signal: 2. , π (sin (2t) (Sin (8t) A discrete time signal x[n] -xs(t) -x(nTs) is created by sampling x() with sampling interval, 2it 60 a) Plot the Fourier Transform of the sampled signal, i.e. Xs (jo). b) Plot the DTFT of the sampled signal, ie, X(eja) o) Repeat (a) with 7, 2π d) Repeat (b) with , 18
Consider the continuous time signal: 2. , π (sin (2t) (Sin (8t) A discrete time signal x[n]...
 21. The signal x(t) = cos(1,8001t – 1/6) is sampled uniformly at the rate of 1 kHz and passed through an ideal low-pass filter with a DC gain of 0.001 and a cutoff frequency of 500 Hz. Find the filter's output.
 3. (50 points] Consider the signal (t= cos(27 (100)+]: 1) Let's take samples of x(t) at a sampling rate fs = 180 Hz. Sketch the spectrum X (f) of the sampled signal x (t). Properly label x-axis and y-axis. 2) Now suppose we will use an ideal lowpass filter of gain 1/fs with a cutoff frequency 90 Hz for the sampled signal xs(t). What is the output of the filter x,(t)? 3) Now let's take samples of x(t) at sampling...
 Consider a sampler which samples the continuous-time input signal x(t) at a sampling frequency fs = 8000 Hz and produces at its output a sampled discrete-time signal x$(t) = x(nTs), where To = 1/fs is the sampling period. If the sampled signal is passed through a unity-gain lowpass filter with cutoff frequency of fs/2, sketch the magnitude spectrum of the resulting signal for the following input signals: (a) x(t) = cos(6000nt). (b) x(t) = cos(12000nt). (c) x(t) = cos(18000nt).
 MATLAB Fourier transform. Suppose that a signal x(t) is sampled
with sampling frequency fs =100Hz.
The sequence x[n] obtained after the sampling is given below:
Take the DFT of the sampled sequence and plot
its magnitude and phase.
What is the frequency resolution (Δf) of your plot?
N= 20, 100 Hz
N= 20, 100 Hz
MATLAB Fourier transform. Suppose that a signal x(t) is sampled
with sampling frequency fs =100Hz.
The sequence x[n] obtained after the sampling is given below:
Take the DFT of the sampled sequence and plot
its magnitude and phase.
What is the frequency resolution (Δf) of your plot?
N= 20, 100 Hz
N= 20, 100 Hz
 1. (50pt) NOTE: To get full mark, you are required to: (1) Plot sampled signals and fitered signals in the frequency domain, (e) Provide solution in time domain and (3 Provide the reasoning. HINT: Take notice on the height of the low pass filter for correct solutions A signal r(t)-cos(3rt) is sampled at a rate of f, samples per second. The sampled signal is then passed through an ideal low pass filter (LPF) with a cutoff frequency at 2 Hz...
 Q. 2 A continuous time signal x(t) has the Continuous Time Fourier Transform shown in Fig 2. Xc() -80007 0 80001 2 (rad/s) Fig 2 According to the sampling theorem, find the maximum allowable sampling period T for this signal. Also plot the Fourier Transforms of the sampled signal X:(j) and X(elo). Label the resulting signals appropriately (both in frequency and amplitude axis). Assuming that the sampling period is increased 1.2 times, what is the new sampling frequency 2? What...
 Using the windowing functions discussed in class, design a
low-pass FIR filter with a cutoff frequency of 2 kHz, a minimum
stop band attenuation of 40 dB, and a transition width of 200Hz.
The sampling frequency is 10kHz.
1. Using the windowing functions discussed in class, design a low-pass FIR filter with a cutoff frequency of 2 kHz, a minimum stop band attenuation of 40 dB, and a transition width of 200 Hz. The sampling frequency is 10 kHz 2....
Using the windowing functions discussed in class, design a
low-pass FIR filter with a cutoff frequency of 2 kHz, a minimum
stop band attenuation of 40 dB, and a transition width of 200Hz.
The sampling frequency is 10kHz.
1. Using the windowing functions discussed in class, design a low-pass FIR filter with a cutoff frequency of 2 kHz, a minimum stop band attenuation of 40 dB, and a transition width of 200 Hz. The sampling frequency is 10 kHz 2....
 Consider the continuous time signal: 2. , π (sin (2t) (Sin (8t) A discrete time signal x[n] -xs(t) -x(nTs) is created by sampling x() with sampling interval, 2it 60 a) Plot the Fourier Transform of the sampled signal, i.e. Xs (jo). b) Plot the DTFT of the sampled signal, ie, X(eja) o) Repeat (a) with 7, 2π d) Repeat (b) with , 18
Consider the continuous time signal: 2. , π (sin (2t) (Sin (8t) A discrete time signal x[n]...
Consider the continuous time signal: 2. , π (sin (2t) (Sin (8t) A discrete time signal x[n] -xs(t) -x(nTs) is created by sampling x() with sampling interval, 2it 60 a) Plot the Fourier Transform of the sampled signal, i.e. Xs (jo). b) Plot the DTFT of the sampled signal, ie, X(eja) o) Repeat (a) with 7, 2π d) Repeat (b) with , 18
Consider the continuous time signal: 2. , π (sin (2t) (Sin (8t) A discrete time signal x[n]...
Most questions answered within 3 hours.
-
Do not neglect the old for the new. The existing business must
not lose priority simply...
asked 35 minutes ago -
Kylie is a single mom with two dependent children,
Tanner, age 7 and Olivia, age 11....
asked 1 hour ago -
Phosphorous + bromine = phosphorous tribromide. If 35.0 g of
bromine are reacted and 27.9 grams...
asked 3 hours ago -
Derive the long wavelength limit of the Planck energy density
distribution
asked 3 hours ago -
Calculate the pH of each of the following solutions.
0.50 M HBr
3.1×10⁻⁴ M KOH
4.2×10⁻⁵...
asked 6 hours ago -
For the year ended December 31, Depot Max’s cost of merchandise
sold was $85,600. Inventory at the...
asked 6 hours ago -
Week 10 - Professional Memo Assignment
Professional Memo Assignment
Your mission for this week, should you...
asked 6 hours ago -
Write a Python program that stores the data for each
player on the team, and it...
asked 7 hours ago -
In
the last 3 months, mike never knows when he is going to get his
allowance...
asked 7 hours ago -
Is Ca(OH)2 a Bronsted base, Lewis base, or both? Why?
asked 7 hours ago -
1A- Why don’t voters complain about U.S. tariffs on imported
sugar?
Because sugar is only a...
asked 7 hours ago -
Cash Payback Period
Primera Banco is evaluating two capital investment proposals for
a drive-up ATM kiosk,...
asked 7 hours ago