

project [Read-Onlyl- Word ut References Mailings Review View Desin Layout 1 Normal 1 No Spac.. Heading1 Heading 2 Ti nt Paragraph Styles Market Kesearch Project Suppose you are a Market Analyst working for a small appliance manufacturer. Your firm is designi and launching sales of a new blender. Before your firm will actually represent and manufacture the product, you need to determine if it will be in the firm's best financial interest to do this. 1. In the following questions, you will do some research and planning for the launch of your new blender. In order to launch your new appliance business, you need to first convince your investors with some market research. There are few considerations you should make. In four well developed paragraphs using the highlighted vocabulary, respond to the following questions. How do production costs impact your profit? Will advertising also impact your profit margins? Identify and describe other costs associated with trying to produce, market, and sell a product? How will these impact your profit? Will it always be the case that the more of an item you produce and sell, the more profit you will make? How do businesses determine their breakeven point and calculate losses? Shipping of goods often depends upon the weight and the dimensions of the container that is being transported to various stores. How might this impact the number of blenders produced and shipped, as well as the size of the blender? Why might it not be a good idea to overproduce a product? How can this impact the profit? How does sales . price and expected revenue impact the profit? 2. Suppose you find that a firm produces and sells x blenders annually, with their total profit (in hundreds of dollars) given by P (x) 1.11x- 23.943-0.003x2 a) Using a graphing utility produce the graph of P in such a way that the appropriate features of the graph are displayed. Print this graph and include it with your submission. In 1-3 sentences explain how you chose what features of the graph you are attempting to display and why? b) Does the graph of ever dip below the x-axis? In 1-3 sentences explain what this cou ld indicates using the vocabulary from part 1. c) Using the graph obtained in part a) estimate the following in interval notation i. For what values of x will P be negative? l. For what values of x will P be positive?
Homework Answers


Add Answer to:
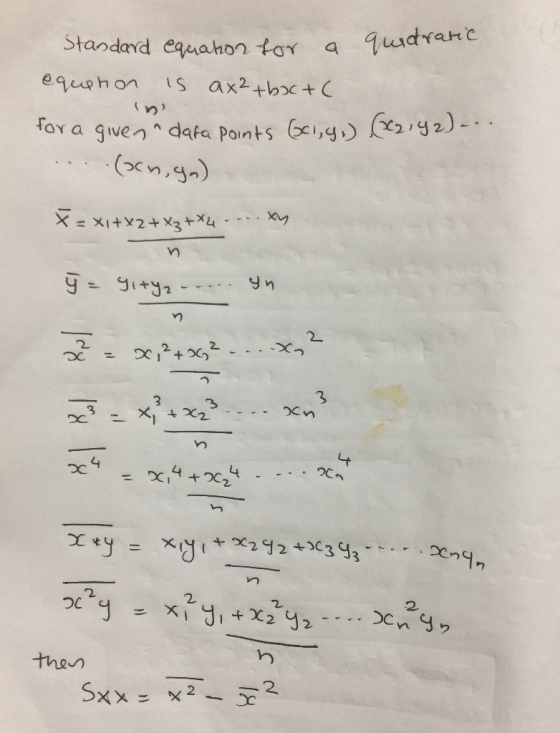
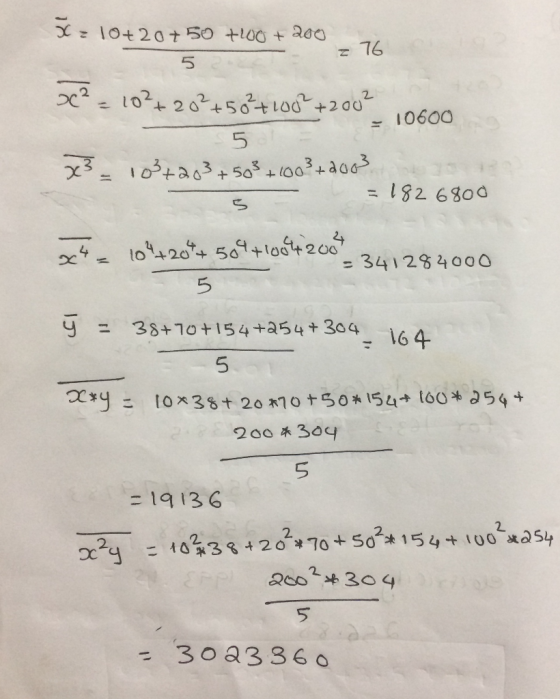
im trying to figure out the equation to determine the shipping cost. AaBbCcD AaBbCD AaBbCr AaBbCct A 1 Normal 1 No Spac... Heading1 Heading 2 Paragraph Styles Consider the following data that y...
х JUUD Heading 1 Heading 3 1 Normal 1 No Spac... Heading 2 Head ht Styles...
 х JUUD Heading 1 Heading 3 1 Normal 1 No Spac... Heading 2 Head ht Styles MC AFC AVC ATC 1 Paragraph A. Short-Run Costs of a Production Schedule. Calculate Table OUTPUT TFC TVC TC 0 200 0 200 175 2 200 300 3 200 500 4 200 800 5 200 1,200 6 200 1,700 7 200 2,300 Determine the following: 1. What is the behīvior of the TC as Output increases? Answer the same question in regard to the...
1Normal No Spac... Heading 1 Heading 2 Title Paragraph Font Styles c. Give two examples of questions you would ask about the following maps in trying to help figure out what they are depicting. de...
 1Normal No Spac... Heading 1 Heading 2 Title Paragraph Font Styles c. Give two examples of questions you would ask about the following maps in trying to help figure out what they are depicting. deceive an data is the following: 1,000 population 1,000 population rate: United 1,000 population the birth rate in. for fares as compared h of these maps would ) and why asked you how C b. if the to
1Normal No Spac... Heading 1 Heading 2 Title...
1Normal No Spac... Heading 1 Heading 2 Title Paragraph Font Styles c. Give two examples of questions you would ask about the following maps in trying to help figure out what they are depicting. deceive an data is the following: 1,000 population 1,000 population rate: United 1,000 population the birth rate in. for fares as compared h of these maps would ) and why asked you how C b. if the to
1Normal No Spac... Heading 1 Heading 2 Title...
Consider total cost and total revenue, given in the following table: In the final column, enter...
 Consider total cost and total revenue, given in the following
table:
In the final column, enter profit for each quantity.
(Note: If the firm suffers a loss, enter a
negative number in the appropriate cell.)
Quantity
Total Cost
Marginal Cost
Total Revenue
Marginal Revenue
Profit
(Dollars)
(Dollars)
(Dollars)
(Dollars)
(Dollars)
0
6
0
1
8
7
2
10
14
3
13
21
4
17
28
5
24
35
6
32
42
7
42
49
In order to maximize profit, how...
Consider total cost and total revenue, given in the following
table:
In the final column, enter profit for each quantity.
(Note: If the firm suffers a loss, enter a
negative number in the appropriate cell.)
Quantity
Total Cost
Marginal Cost
Total Revenue
Marginal Revenue
Profit
(Dollars)
(Dollars)
(Dollars)
(Dollars)
(Dollars)
0
6
0
1
8
7
2
10
14
3
13
21
4
17
28
5
24
35
6
32
42
7
42
49
In order to maximize profit, how...
**Only [Harder] Question** Problem 2. Consider a firm that has a cost function of c(y) =...
**Only [Harder] Question** Problem 2. Consider a firm that has a cost function of c(y) = 5y 2 + 50, 000. In other words, this is a firm with a fixed cost of $50,000 (which might be something like the cost of rent on the firm’s building, which they have to pay whether they produce any output or not) and a variable cost of $5Y 2 , (which we’ll think of as the cost of the labor and machinery necessary...
You are given the following cost data: Total fixed costs are $30. q TVC 0 0...
You are given the following cost data: Total fixed costs are $30. q TVC 0 0 1 30 2 60 3 105 4 165 5 255 6 375 If the price of output is $60, how many units of output will this firm produce (assuming the firm produces in the short run, in a competitive market)? The firm will produce nothing units of output because this is where price equals ▼ average variable cost marginal cost average fixed cost ....
CHAPTER 23 – ASSIGNMENT #1 Answer the following questions using the graph shown below. Assume that...
 CHAPTER 23 – ASSIGNMENT #1 Answer the following questions using
the graph shown below. Assume that the firm is producing the number
of units that will maximize their profit in a perfectly competitive
market. You can use the explanatory for problem 23-3 that are in
the Handouts on the main page of your course website to aid you in
the completion of this problem. The D curve in this problem is the
same as the MR curve. ? • How...
CHAPTER 23 – ASSIGNMENT #1 Answer the following questions using
the graph shown below. Assume that the firm is producing the number
of units that will maximize their profit in a perfectly competitive
market. You can use the explanatory for problem 23-3 that are in
the Handouts on the main page of your course website to aid you in
the completion of this problem. The D curve in this problem is the
same as the MR curve. ? • How...
Proft Price Number of writes gvenpien Total Total Warpiel Total Fued toduction Revenue Avenue Cost l...
 Proft Price Number of writes gvenpien Total Total Warpiel Total Fued toduction Revenue Avenue Cost l P 1Q T Coast Coast Cast Coast Coast TCTC+TIC TOO TGIR 0 $80 180 0 2 0 1 2 3 4 5 120 9 12 0 $ 0 160 $80 400 120 720 ERO $960 O 1.1 20 0 31200 0 0 $300 3300 3200 200 $300 $300 5300 $150 $300 $450 $600 $750 300 3 00 M $ $75 $600 +750 150 $900...
Question 6 e and f 5) Base scenario calculations: Using the Profit Formula calculated in 5)...
 Question 6 e and f
5) Base scenario calculations: Using the Profit Formula calculated in 5) above, calculate the following assuming TrucBeat produces and sells 6,000 units as their "base" scenario Sales Revenue 6,00 SIL - 3.045,00 Net Operating Income 1,778. Ob Contribution Margin 2.052/ Contribution Margin Contribution Margin percent 2.082,0/3,091,00 87.252 Break-even in units 304,0*/62087, 00/000304,00) 347 976 units Break-even in dollars 3040/67.25 452,046 Margin of safety in units 6.400- 76+ 5.124 wnik Margin of safety percent (3.06,0 -...
Question 6 e and f
5) Base scenario calculations: Using the Profit Formula calculated in 5) above, calculate the following assuming TrucBeat produces and sells 6,000 units as their "base" scenario Sales Revenue 6,00 SIL - 3.045,00 Net Operating Income 1,778. Ob Contribution Margin 2.052/ Contribution Margin Contribution Margin percent 2.082,0/3,091,00 87.252 Break-even in units 304,0*/62087, 00/000304,00) 347 976 units Break-even in dollars 3040/67.25 452,046 Margin of safety in units 6.400- 76+ 5.124 wnik Margin of safety percent (3.06,0 -...
1. Consumer’s utility function is: U (X,Y) = 10X + Y. Consumer’s income M is 40...
1. Consumer’s utility function is: U (X,Y) = 10X + Y. Consumer’s income M is 40 euros, the price per unit of good X (i.e. Px ) is 5 euros and the price per unit of good Y (i.e. Py) is 1 euro. a) What is the marginal utility of good X (MUx) for the consumer? ( Answer: MUx = 10) b) What is the marginal utility of good Y (MUy) for the consumer? ( Answer: MUy = 1) c)...
Question 9 1) Summarize the information for TrueBeat from Q9 & 10 of HW1.1 assuming they...
 Question 9
1) Summarize the information for TrueBeat from Q9 & 10 of HW1.1 assuming they produce and sell 1,000 drum sets during the year. Remember to use 2 decimals for "per unit" values. Total Dollars True Beat - Summarized connect given data Average Cost per Unit Direct materials 19 Direct labor $ 90 Variable manufacturing overhead $ 35 Fixed manufacturing overhead $ Fixed selling & administrative expense $ Variable selling & administrative expenses 25 Sales price per unit 516...
Question 9
1) Summarize the information for TrueBeat from Q9 & 10 of HW1.1 assuming they produce and sell 1,000 drum sets during the year. Remember to use 2 decimals for "per unit" values. Total Dollars True Beat - Summarized connect given data Average Cost per Unit Direct materials 19 Direct labor $ 90 Variable manufacturing overhead $ 35 Fixed manufacturing overhead $ Fixed selling & administrative expense $ Variable selling & administrative expenses 25 Sales price per unit 516...
 х JUUD Heading 1 Heading 3 1 Normal 1 No Spac... Heading 2 Head ht Styles MC AFC AVC ATC 1 Paragraph A. Short-Run Costs of a Production Schedule. Calculate Table OUTPUT TFC TVC TC 0 200 0 200 175 2 200 300 3 200 500 4 200 800 5 200 1,200 6 200 1,700 7 200 2,300 Determine the following: 1. What is the behīvior of the TC as Output increases? Answer the same question in regard to the...
 1Normal No Spac... Heading 1 Heading 2 Title Paragraph Font Styles c. Give two examples of questions you would ask about the following maps in trying to help figure out what they are depicting. deceive an data is the following: 1,000 population 1,000 population rate: United 1,000 population the birth rate in. for fares as compared h of these maps would ) and why asked you how C b. if the to
1Normal No Spac... Heading 1 Heading 2 Title...
1Normal No Spac... Heading 1 Heading 2 Title Paragraph Font Styles c. Give two examples of questions you would ask about the following maps in trying to help figure out what they are depicting. deceive an data is the following: 1,000 population 1,000 population rate: United 1,000 population the birth rate in. for fares as compared h of these maps would ) and why asked you how C b. if the to
1Normal No Spac... Heading 1 Heading 2 Title...
 Consider total cost and total revenue, given in the following
table:
In the final column, enter profit for each quantity.
(Note: If the firm suffers a loss, enter a
negative number in the appropriate cell.)
Quantity
Total Cost
Marginal Cost
Total Revenue
Marginal Revenue
Profit
(Dollars)
(Dollars)
(Dollars)
(Dollars)
(Dollars)
0
6
0
1
8
7
2
10
14
3
13
21
4
17
28
5
24
35
6
32
42
7
42
49
In order to maximize profit, how...
Consider total cost and total revenue, given in the following
table:
In the final column, enter profit for each quantity.
(Note: If the firm suffers a loss, enter a
negative number in the appropriate cell.)
Quantity
Total Cost
Marginal Cost
Total Revenue
Marginal Revenue
Profit
(Dollars)
(Dollars)
(Dollars)
(Dollars)
(Dollars)
0
6
0
1
8
7
2
10
14
3
13
21
4
17
28
5
24
35
6
32
42
7
42
49
In order to maximize profit, how...
 CHAPTER 23 – ASSIGNMENT #1 Answer the following questions using
the graph shown below. Assume that the firm is producing the number
of units that will maximize their profit in a perfectly competitive
market. You can use the explanatory for problem 23-3 that are in
the Handouts on the main page of your course website to aid you in
the completion of this problem. The D curve in this problem is the
same as the MR curve. ? • How...
CHAPTER 23 – ASSIGNMENT #1 Answer the following questions using
the graph shown below. Assume that the firm is producing the number
of units that will maximize their profit in a perfectly competitive
market. You can use the explanatory for problem 23-3 that are in
the Handouts on the main page of your course website to aid you in
the completion of this problem. The D curve in this problem is the
same as the MR curve. ? • How...
 Proft Price Number of writes gvenpien Total Total Warpiel Total Fued toduction Revenue Avenue Cost l P 1Q T Coast Coast Cast Coast Coast TCTC+TIC TOO TGIR 0 $80 180 0 2 0 1 2 3 4 5 120 9 12 0 $ 0 160 $80 400 120 720 ERO $960 O 1.1 20 0 31200 0 0 $300 3300 3200 200 $300 $300 5300 $150 $300 $450 $600 $750 300 3 00 M $ $75 $600 +750 150 $900...
 Question 6 e and f
5) Base scenario calculations: Using the Profit Formula calculated in 5) above, calculate the following assuming TrucBeat produces and sells 6,000 units as their "base" scenario Sales Revenue 6,00 SIL - 3.045,00 Net Operating Income 1,778. Ob Contribution Margin 2.052/ Contribution Margin Contribution Margin percent 2.082,0/3,091,00 87.252 Break-even in units 304,0*/62087, 00/000304,00) 347 976 units Break-even in dollars 3040/67.25 452,046 Margin of safety in units 6.400- 76+ 5.124 wnik Margin of safety percent (3.06,0 -...
Question 6 e and f
5) Base scenario calculations: Using the Profit Formula calculated in 5) above, calculate the following assuming TrucBeat produces and sells 6,000 units as their "base" scenario Sales Revenue 6,00 SIL - 3.045,00 Net Operating Income 1,778. Ob Contribution Margin 2.052/ Contribution Margin Contribution Margin percent 2.082,0/3,091,00 87.252 Break-even in units 304,0*/62087, 00/000304,00) 347 976 units Break-even in dollars 3040/67.25 452,046 Margin of safety in units 6.400- 76+ 5.124 wnik Margin of safety percent (3.06,0 -...
 Question 9
1) Summarize the information for TrueBeat from Q9 & 10 of HW1.1 assuming they produce and sell 1,000 drum sets during the year. Remember to use 2 decimals for "per unit" values. Total Dollars True Beat - Summarized connect given data Average Cost per Unit Direct materials 19 Direct labor $ 90 Variable manufacturing overhead $ 35 Fixed manufacturing overhead $ Fixed selling & administrative expense $ Variable selling & administrative expenses 25 Sales price per unit 516...
Question 9
1) Summarize the information for TrueBeat from Q9 & 10 of HW1.1 assuming they produce and sell 1,000 drum sets during the year. Remember to use 2 decimals for "per unit" values. Total Dollars True Beat - Summarized connect given data Average Cost per Unit Direct materials 19 Direct labor $ 90 Variable manufacturing overhead $ 35 Fixed manufacturing overhead $ Fixed selling & administrative expense $ Variable selling & administrative expenses 25 Sales price per unit 516...
Most questions answered within 3 hours.
-
For the following reaction, 0.128 moles of
potassium hydrogen sulfateare mixed with
0.504 moles of potassium...
asked 2 hours ago -
1. What is the present value of $400, three years in the future
if the interest...
asked 2 hours ago -
The labor force minus the number of employed equals the number
of unemployed.
a. True
b....
asked 5 hours ago -
Determine the mass in units of grams [g] of 0.49 moles [mol]
of a new fictitious...
asked 5 hours ago -
A horizontal mass of M=5kg is on a spring and stretched to
x=0.5m when released from...
asked 6 hours ago -
26 of 50
"I have worked at the Arizona Humane Society for ten years, and
have...
asked 7 hours ago -
Compare and contrast zero based budgeting and incremental (or
base year) budgeting.
asked 7 hours ago -
4 pts 10. Which of the following hypothesis would be MOST
difficult to test experimentally? Group...
asked 7 hours ago -
A business owner makes 1,000 items a day. Each day he or she
contributes eight hours...
asked 7 hours ago -
A
circular loop in the plane of a paper lies inca0.65 T magnetic
field pointing into...
asked 7 hours ago -
A business owner is trying to decide whether to buy, rent, or
lease office space and...
asked 7 hours ago -
Thermal Storage Solar heating of a house is much more efficient
if there is a way...
asked 7 hours ago