


On the above graph, you can see that the concentration profile is curved if you look at the entire concentration vs. time plot. However, if you look at only the part of the curve near the beginning of the reaction, the change of concentration with time appears to be linear. It's only when the concentration falls substantially see that the profile is curved. The above plot is for a first order reaction. You must plot the natural log (In) of the concentration to get a straight line across the entire graph (the straight line shown below the curve). But even the concentration itself seems to plot as a straight line if the concentration has decreased by only a small amount from its original value. observation period. from its starting value that you can Therefore, l advise against analyzing data where too little of the reactant is consumed during the At the other extreme, if the reaction is too fast, the reactant may decay to zero concentration in such a short time that very few data points are available for analysis. I would likewise, advise against attempting to analyze such data. You are looking for that "happy medium" where there is substantial loss of reactant during the observation period, but in which enough data is available to give a meaningful analysis. Another problem you may encounter with some reactions at certain temperatures is when the concentration is near zero. The concentrations are measured to the nearest 0.001 M, so for slow decays, you may have multiple time points with the same value when reported to 3 decimal places. For following set of concentrations, taken at consecutive 10-second time points a very slow decay of concentration example, consider the 0.007 M 0.007 M 0.006 M 0.006 M 0.006 M 0.005 M 0.005 M 140 s 150 s 160 s 170s 180s 190 s 200 s
Although the concentration drops continuously over the time interval from 140 s to 200 s, the decay rate is so slow that the changes from one time point to the next occur beyond the third decimal place, and therefore, are not shown in the data. The data give the impression that the concentration hangs at one value for an extended period of time, then suddenly drops to a slightly lower value, hangs there for a while, and so on. But this is an artifact of the rounding. If more decimal places were available, we could see that the concentration drops continuously, albeit slowly. If you are plotting this data (whether the data itself, or some function of it, such as the natural log) you will end up with some points having the same Y value for two or more different x values. Data points of this nature seem to suggest that the linear fit is a horizontal line - that is, a line having a zero slope. But that can't be right, because it would mean that the reactant concentration is not changing with time. Even when such "problematic" data points are in your set, you will probably still get a fairly good fit because the data points from earlier in the reaction- when the concentration was changing faster- will help offset the "bad" data points. Even so, since you have a lot of data to choose from, it would probably be a good idea to avoid data that has plateaus, unless the use of such data is unavoidable. The data you have been provided is noise-free and error-free. It's what you would measure in a perfect world using an instrument that measures concentration to the nearest 0.001 M. So if you choose your data carefully (that is, which temperatures to use), you should be able to obtain a perfect linear fit (R 1) when plotting data that that should be linear.
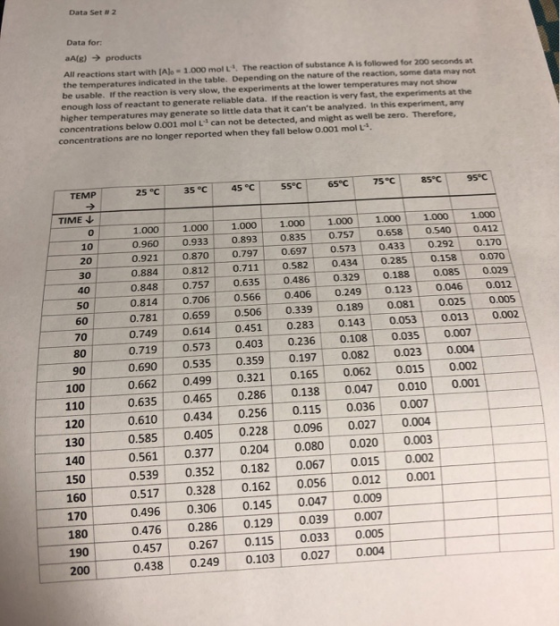
Data Set # 2 Data for aA(g) → products All reactions start with (AJo 1.000 mol L4, The reaction of substance A is followed for 200 seconds at the temperatures indicated in the table. Depending on the nature of the reaction, some data may not be usable. If the reaction is very slow, the experiments at the lower temperatures may not show enough loss of reactant to generate reliable data. If the reaction is very fast, the experiments at the higher temperatures may generate so little data that it can't be analyzed. In this experiment, any concentrations below 0.001 mol LJ can not be detected, and might as well be zero. Therefore, concentrations are no longer reported when they fall below 0.001 mol LJ TIME ↓ 1.0001.0001.0001.000 1.000 1.000 1.000 1.000 0.960 0.9330.893 0.835 0.757 0.6580.540 0.412 0.9210.8700.797 0.697 0.573 0.433 0.292 0.170 0.884 0.812 0.711 0.582 0.434 0.2850.158 0.070 0.848 0.757 0.635 0.486 0.329 0.188 0.085 0.029 0.814 0.70.566 0.4060.249 0.123 0.046 0.012 0.781 0.659 0.506 0.339 0.189 0.081 0.025 0.005 0.749 0.6140.451 0.2830.143 0.053 0.013 0.002 0.719 0.573 0.403 0.236 0.108 0.035 0.007 0.690 0.535 0.359 0.197 0.082 0.023 0.004 0.662 0.499 0.321 0.165 0.062 0.015 0.002 0.635 0.465 0.286 0.138 0.047 0.010 0.001 0.610 0.434 0.256 0.115 0.036 0.007 0.585 0.405 0.228 0.096 0.027 0.004 0.561 0.377 0.204 0.080 0.020 0.003 0.539 0.352 0.182 0.067 0.5 0.002 0.517 0.328 0.162 0.056 0.012 0.001 0.496 0.306 0.145 0.047 0.009 0.476 0.286 0.129 0.039 0.007 0.457 0.267 0.115 0.033 0.005 0.438 0.249 0.1030.027 0.004
TIME ph, you can see that the concentration profile is curved if you look at the entire concentration vs. the above gra t. However, if you look at only the part of the curve near the beginning of the reaction, the change of concent h time appears to be linear. It's only when the concentration falls substantially from its starting value that you that the profile is curved. The above plot is for a first order reaction. You must plot the natural log (In) of the centration to get a straight line across the entire graph (the straight line shown below the curve). But entration itself seems to plot as a straight line if the concentration has decreased by only a small amount fr nal value. Therefore, I advise against analyzing data where too little of the reactant is consumed during the rvation period. eother extreme, if the reaction is too fast, the reactant may decay to zero concentration in such a short t ew data points are available for analysis. I would likewise, advise against attempting to analyze such dat g for that "happy medium" where there is substantial loss of reactant during the observation period, bu gh data is available to give a meaningful analysis. encounter with some reactions at certain temperatures is a very slow decay of co measured to the nearest 0.001 M, so for slow d ar erample, conside
Homework Answers


Add Answer to:
will work with up to 3 partners (similar to a lab group) to prepare a written report which analyzes kinetic data that has been provided to you. All student groups will receive data for the hy...
QuestiII Il poll ILS) Consider the data below: Time (minutes) Concentration (M) 1 0.05 2 0.042...
 QuestiII Il poll ILS) Consider the data below: Time (minutes) Concentration (M) 1 0.05 2 0.042 3 0.034 4 0.028 5 0.018 Construct a concentration versus time plot with concentration on the y-axis and time on the x-axis. Then, determine the equation of the line that describes the data set. In blank # 1, report the slope of the line. Do not use scientific notation. In blank # 2, report the y-intercept of the line. Do not use scientific notation....
Need help with the first picture. Data provided in pictures #2 & #3 Determining the Activation...
 Need help with the first picture. Data provided in pictures #2
& #3
Determining the Activation Energy and Collision Frequency Factor for Reaction 1 Part 1. Transfer the reaction rate for runs 9.12 from Data Sheet 3. Then calculate the rate constant (R) at each temperature based on the reaction orders determined in parts and Record the results in Tables * = 18,0 ->15.0416"5,0216" Equation 6 ->25 10 2. Calculate the natural logarithm of the rate constant. In ) and...
Need help with the first picture. Data provided in pictures #2
& #3
Determining the Activation Energy and Collision Frequency Factor for Reaction 1 Part 1. Transfer the reaction rate for runs 9.12 from Data Sheet 3. Then calculate the rate constant (R) at each temperature based on the reaction orders determined in parts and Record the results in Tables * = 18,0 ->15.0416"5,0216" Equation 6 ->25 10 2. Calculate the natural logarithm of the rate constant. In ) and...
just one example/demonstration! Data needed to be calculated is in highlighted in green boxes. And I...
 just one example/demonstration!
Data needed to be calculated is in highlighted in green boxes.
And I highlighted in red an equation (not sure if thats what you
use to calculate it) And ignore the lab instructions on completeing
a graph!! I already know how to do that in excel, just curious how
Ln (relative rate) and 1/T in K^-1 is calculated by hand*
here is the rest of that lab leading up to the question as I
know its typically...
just one example/demonstration!
Data needed to be calculated is in highlighted in green boxes.
And I highlighted in red an equation (not sure if thats what you
use to calculate it) And ignore the lab instructions on completeing
a graph!! I already know how to do that in excel, just curious how
Ln (relative rate) and 1/T in K^-1 is calculated by hand*
here is the rest of that lab leading up to the question as I
know its typically...
 QuestiII Il poll ILS) Consider the data below: Time (minutes) Concentration (M) 1 0.05 2 0.042 3 0.034 4 0.028 5 0.018 Construct a concentration versus time plot with concentration on the y-axis and time on the x-axis. Then, determine the equation of the line that describes the data set. In blank # 1, report the slope of the line. Do not use scientific notation. In blank # 2, report the y-intercept of the line. Do not use scientific notation....
 Need help with the first picture. Data provided in pictures #2
& #3
Determining the Activation Energy and Collision Frequency Factor for Reaction 1 Part 1. Transfer the reaction rate for runs 9.12 from Data Sheet 3. Then calculate the rate constant (R) at each temperature based on the reaction orders determined in parts and Record the results in Tables * = 18,0 ->15.0416"5,0216" Equation 6 ->25 10 2. Calculate the natural logarithm of the rate constant. In ) and...
Need help with the first picture. Data provided in pictures #2
& #3
Determining the Activation Energy and Collision Frequency Factor for Reaction 1 Part 1. Transfer the reaction rate for runs 9.12 from Data Sheet 3. Then calculate the rate constant (R) at each temperature based on the reaction orders determined in parts and Record the results in Tables * = 18,0 ->15.0416"5,0216" Equation 6 ->25 10 2. Calculate the natural logarithm of the rate constant. In ) and...
 just one example/demonstration!
Data needed to be calculated is in highlighted in green boxes.
And I highlighted in red an equation (not sure if thats what you
use to calculate it) And ignore the lab instructions on completeing
a graph!! I already know how to do that in excel, just curious how
Ln (relative rate) and 1/T in K^-1 is calculated by hand*
here is the rest of that lab leading up to the question as I
know its typically...
just one example/demonstration!
Data needed to be calculated is in highlighted in green boxes.
And I highlighted in red an equation (not sure if thats what you
use to calculate it) And ignore the lab instructions on completeing
a graph!! I already know how to do that in excel, just curious how
Ln (relative rate) and 1/T in K^-1 is calculated by hand*
here is the rest of that lab leading up to the question as I
know its typically...
Most questions answered within 3 hours.
-
What is the methodology that should be used when developing a
risk management plan for an...
asked 32 minutes ago -
The factory method and the abstract factory pattern use
different object oriented
mechanisms are used to...
asked 4 hours ago -
Given the data below for the monthly sales data at each branch in
your region for...
asked 5 hours ago -
Blossom Company owns 10000 of the 50000 outstanding shares of
Taylor, Inc. common stock. During 2018,...
asked 6 hours ago -
Calculate the following: ***SHOW ALL WORK!!!! Or
NO CREDIT*** Circle your answers. 8pts
each
In the...
asked 8 hours ago -
Bank Z is currently advertising interest rates on its checking
account. They claim to pay an...
asked 7 hours ago -
List two ways of transformation on the response variable that
can be used to deal with...
asked 8 hours ago -
If a 2000 ohm resistor has a -3.90 mA current going through it.
What is the...
asked 8 hours ago -
Please comment on the sentences.
Some types of jobs require more training than others. Some
companies...
asked 9 hours ago -
The )G01 for the hydrolysis of phosphorarginine
reaction depicted below is –32 kJ mol-1.
Phosphoarginine ...
asked 10 hours ago -
Cross a heterozygous blue-eyed goat with a homozygous brown-eyed
goat. Be sure to indicate which kids...
asked 10 hours ago -
Use the following information to answer the next two
questions.
Please refer to question 9-90. A...
asked 11 hours ago