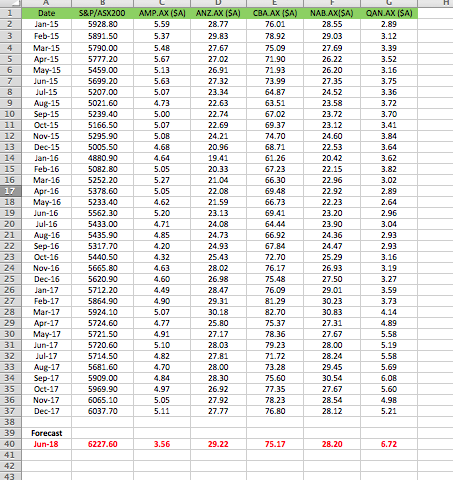

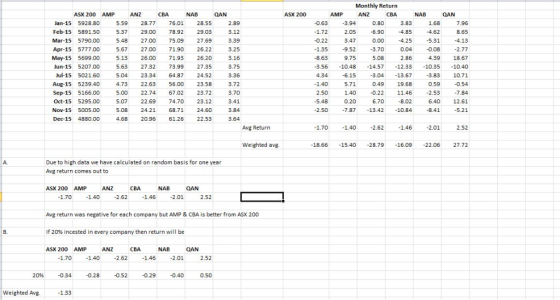
In January 2018, you joined Tri-Star Management Pty Ltd as an intern. On your first day, your CEO asks you to analyze information pertaining to share prices of five companies: AMP Limited (AMP.AX), Australia and New Zealand Banking Group Limited (ANZ.AX), Commonwealth Bank of Australia (CBA.AX), National Australia Bank Limited (NAB.AX) and Qantas Airways Limited (QAN.AX). The file 2019 FIN510.xlsx contains data on the adjusted end of month share prices of these five companies from January 2015 December 2017. In addition, you are provided with the value of the S&P/ASX200 market index over this period. The basic data are provided in columns A-G. You will be asked a series of questions to guide your analysis. You will need to manipulate the data to answer the questions below. Some Excel formulas are provided in the worksheet. Part 1: Average returns [5 marks 3 2 marks] Compute the monthly return on the shares of each company and the ASX200 index by using the following formula: Returnt x100 wbere Pt is the share price (or the value of ASX200 index) in time period t. (Please note that you lose the first observation when calculating returns.) (a) Using the monthly returns, calculate the average return on shares of each company from February 2015 - December 2017. Compare them with the average return on the ASX200 index. (b) Suppose an investor created an equally weighted portfolio of these five companies (i.e. invested 20% of funds in each company). what would be the average return on the portfolio? Explain how you derived your answer.
Homework Answers
| Due to high data we have calculated on random basis for one year |
Add Answer to:
89 2 3 5 6 5 6 2 70 4 4 4 2 2 2 9 4 6 4 3 3 6 9 2 9 7 4 9 5 9 5 60 60 98 LA 534 80 50 00 20 00 20 00 60 40 50 90 50 90 80 20 60 40 30 00 90 70 50 80 90 20 90 10 60 50 60 50 60 00 90 10 70 0 1 0 7 9 9...
3323435354 2131542136 4 os 456 5 9 70 20 35 00 40 20 00 60 20 40 40 162 ,6 7 4753 af st e-ta 0 63...
 3323435354 2131542136 4 os 456 5 9 70 20 35 00 40 20 00 60 20 40 40 162 ,6 7 4753 af st e-ta 0 6323 533-61 3472 54 Do flo 9, 5, 1, bl ei 5678901234567890123 44455555555556666 6. Assume the flow data given in Problem 1 follows log Pearson III Type distribution. (a) Peak flow of the 100 year flood (b) Peak flow of the 50 year flood (21823, 17580) 100 year flood. Muskingum Method of routing. 7....
QUESTION 1 Figure 2-5 100 90 80 70 60 50 40 30 20 10 10 20...
 QUESTION 1 Figure 2-5 100 90 80 70 60 50 40 30 20 10 10 20 30 40 50 60 70 80 washe Refer to Figure 2-5. It is possible for this economy to produce O a. 60 dryers and 50 washers. b. 60 dryers and 60 washers. c. 80 dryers and 50 washers. O d. All of the above.
Oxygen Rate of Production over time Oxygen production 90 80 70 60 50 40 30 20...
 Oxygen Rate of Production over time Oxygen production 90 80 70 60 50 40 30 20 10 0 1 2 3 5 6 7 4 Time (seconds) Series1 -Series2 -Series3 Which line on the graph represents no reaction?
Oxygen Rate of Production over time 90 80 70 60 Oxygen production 50 40 30 20...
 Oxygen Rate of Production over time 90 80 70 60 Oxygen production 50 40 30 20 10 0 1 2 3 4 5 6 7 Time (seconds) Series1 Series2 Series3 Which line on the graph represents a reaction that increases the most over time?
Wind speed ydu 10 15 20 30 40 50 60 5 2 4 5 9 14...
 Wind speed ydu 10 15 20 30 40 50 60 5 2 4 5 9 14 19 24 1 hours the wind has been blowing 10 15 20 30 40 2 2 2 2 4 5 5 5 5 7 8 8 9 9 13 16 17 18 19 21 25 28 31 33 29 36 40 45 48 47 54 62 67 50 2 5 9 19 33 50 69 37 The table gives n(t,v) feet, the height of...
Question Completion Status: 10 20 30 40 50 60 70 80 90 100 110 120 130...
 Question Completion Status: 10 20 30 40 50 60 70 80 90 100 110 120 130 140 > Moving to another question will save this response. uestion 17 T-6 T-4 Start T-5 T-7 Finish T=5 T-6 Given the network in Figure, the time to complete those activities on the critical path is expected to be OA) 20 B) 22 Oo oo D) 26 A Moving to another question will save this response.
9-55 Year E Sens 0 $90 -$110-$100 $120 35 35 35 35 9-60 20 2 20 20 4 20 5 20 6 20 10 20 30 40 50 ...
 9-55 Year E Sens 0 $90 -$110-$100 $120 35 35 35 35 9-60 20 2 20 20 4 20 5 20 6 20 10 20 30 40 50 180 )Based on the payback period, which altermnative-41 Amal (b) Based on future worth analysis, which of the (c) Based on future worth analysis, which alterna- (a) At 10% interest, what is the benefit-cost ratio is preferred? four alternatives is preferred at 5% interest? tive is preferred at 20% interest? for Alt....
MR Demand 10 20 30 40 50 60 70 80 Duantity Refer to Figure 15-20. The...
 MR Demand 10 20 30 40 50 60 70 80 Duantity Refer to Figure 15-20. The deadweight loss caused by a profit-maximizing monopoly amounts to a. $900. b. $225. c. $1,350. d. $450 Price MC 4+ F + 1 + 2 + 4 Demand 10 11 12 3 5 6 7 8 9 Quantity Refer to Figure 15-11. Which area represents the deadweight loss from monopoly? a. H b. A+B+C+D+F+I+J+H O c. S+H d. J Price MC Demand iMR: 10...
$20 ATC 15 10 5 0 10 20 30 40 50 Quantity 60 70 80 Refer...
 $20 ATC 15 10 5 0 10 20 30 40 50 Quantity 60 70 80 Refer to the diagram showing the average total cost curve for a purely competitive firm. At the long-run equilibrium level of output, this firm's economic profit: is zero is $400 O is $200 cannot be determined from the information provided.
Compound 4, C,H,602 IU 90 80 70 60 50 40 30 20 10 0! 4000 3500...
 Compound 4, C,H,602 IU 90 80 70 60 50 40 30 20 10 0! 4000 3500 3000 2500 2000 1800 1600 1400 1200 1000 800 3 Н 2 H 5H 10 7 Identification of Organic Compounds Using IR and 'H-NMR Spectroscopy The following infrared and proton NMR spectra provide a good introduction to the use of these techniques for identifying organic compounds and their structures. The top spectra are IR and the bottom spectra are H-NMR. Based on the spectra...
 3323435354 2131542136 4 os 456 5 9 70 20 35 00 40 20 00 60 20 40 40 162 ,6 7 4753 af st e-ta 0 6323 533-61 3472 54 Do flo 9, 5, 1, bl ei 5678901234567890123 44455555555556666 6. Assume the flow data given in Problem 1 follows log Pearson III Type distribution. (a) Peak flow of the 100 year flood (b) Peak flow of the 50 year flood (21823, 17580) 100 year flood. Muskingum Method of routing. 7....
 QUESTION 1 Figure 2-5 100 90 80 70 60 50 40 30 20 10 10 20 30 40 50 60 70 80 washe Refer to Figure 2-5. It is possible for this economy to produce O a. 60 dryers and 50 washers. b. 60 dryers and 60 washers. c. 80 dryers and 50 washers. O d. All of the above.
 Oxygen Rate of Production over time Oxygen production 90 80 70 60 50 40 30 20 10 0 1 2 3 5 6 7 4 Time (seconds) Series1 -Series2 -Series3 Which line on the graph represents no reaction?
 Oxygen Rate of Production over time 90 80 70 60 Oxygen production 50 40 30 20 10 0 1 2 3 4 5 6 7 Time (seconds) Series1 Series2 Series3 Which line on the graph represents a reaction that increases the most over time?
 Wind speed ydu 10 15 20 30 40 50 60 5 2 4 5 9 14 19 24 1 hours the wind has been blowing 10 15 20 30 40 2 2 2 2 4 5 5 5 5 7 8 8 9 9 13 16 17 18 19 21 25 28 31 33 29 36 40 45 48 47 54 62 67 50 2 5 9 19 33 50 69 37 The table gives n(t,v) feet, the height of...
 Question Completion Status: 10 20 30 40 50 60 70 80 90 100 110 120 130 140 > Moving to another question will save this response. uestion 17 T-6 T-4 Start T-5 T-7 Finish T=5 T-6 Given the network in Figure, the time to complete those activities on the critical path is expected to be OA) 20 B) 22 Oo oo D) 26 A Moving to another question will save this response.
 9-55 Year E Sens 0 $90 -$110-$100 $120 35 35 35 35 9-60 20 2 20 20 4 20 5 20 6 20 10 20 30 40 50 180 )Based on the payback period, which altermnative-41 Amal (b) Based on future worth analysis, which of the (c) Based on future worth analysis, which alterna- (a) At 10% interest, what is the benefit-cost ratio is preferred? four alternatives is preferred at 5% interest? tive is preferred at 20% interest? for Alt....
 MR Demand 10 20 30 40 50 60 70 80 Duantity Refer to Figure 15-20. The deadweight loss caused by a profit-maximizing monopoly amounts to a. $900. b. $225. c. $1,350. d. $450 Price MC 4+ F + 1 + 2 + 4 Demand 10 11 12 3 5 6 7 8 9 Quantity Refer to Figure 15-11. Which area represents the deadweight loss from monopoly? a. H b. A+B+C+D+F+I+J+H O c. S+H d. J Price MC Demand iMR: 10...
 $20 ATC 15 10 5 0 10 20 30 40 50 Quantity 60 70 80 Refer to the diagram showing the average total cost curve for a purely competitive firm. At the long-run equilibrium level of output, this firm's economic profit: is zero is $400 O is $200 cannot be determined from the information provided.
 Compound 4, C,H,602 IU 90 80 70 60 50 40 30 20 10 0! 4000 3500 3000 2500 2000 1800 1600 1400 1200 1000 800 3 Н 2 H 5H 10 7 Identification of Organic Compounds Using IR and 'H-NMR Spectroscopy The following infrared and proton NMR spectra provide a good introduction to the use of these techniques for identifying organic compounds and their structures. The top spectra are IR and the bottom spectra are H-NMR. Based on the spectra...
Most questions answered within 3 hours.
-
Two waves are traveling on a string, one with a wave function,
y1 = 0.05sin(4x -...
asked 4 minutes ago -
Develop an ideal customer profile for three Dell Customer
groups( a supplier, a global business, and...
asked 6 minutes ago -
Suppose, for any future year, the probability its October rain
is more than 3 inches is...
asked 11 minutes ago -
Solve the following systems of linear equations using
substitution 12p + 3q = 15 6q +...
asked 18 minutes ago -
Prof. D went grocery shopping and purchased one dozen eggs and
one pound of flour (all...
asked 25 minutes ago -
If
somehow loop of Henle were removed - that is if the proximal tubule
was connected...
asked 25 minutes ago -
Add 1ml of 0.18M of HCl (aq) to 1ml of 0.2M of [Ag(NH3)2]Br
(aq).
Write the...
asked 33 minutes ago -
1. Smoke detectors use Am-241, an alpha emitter, to detect smoke
particles. A parent is concerned...
asked 37 minutes ago -
Scenario: Web application developed to capture customers
demographic and financial information for filling their taxes. This...
asked 41 minutes ago -
Which of the following statements are true?
1. Glass is mostly silicon dioxide and so when...
asked 1 hour ago -
Korman Company has the following securities in its portfolio of
equity securities on December 31, 2018:...
asked 1 hour ago -
Using the 12th edition of Language Awareness,
complete the following assignment:
After reading Akiba Solomon's "Thugs....
asked 1 hour ago