
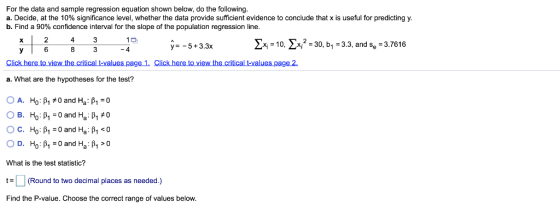
For the data and sample regression equation shown below, do the following. a. Decide, at the 10% significance level whether the data provide sufficient evidence to conclude b. Find a 90% confidence interval for the slope of the population regression line aks useful or predicting 213 4 8 Σ,-10, Σ 2 = 30, b1-3.3, and se-3.7616 y®-5+3.3x Click here to view the critical t-values page 1. Click here to view the critical t-values page 2. a. What are the hypotheses for the test? D. Ho: P1 and H 1 What is the test statistic? (Round to two decimal places as needed.) Find the P-value. Choose the correct range of values below.
Homework Answers
Applying regression on above data:

a)
option B is correct for hypothesis
test statistic t =1.96
p value =0.1888
for conclusion: option A is correct
b)
90% COnfidence interval =-1.612 , 8.212
Add Answer to:
Which of the following is the correct conclusion for the hypothesis test? A. Do not reject Ho; the data do not provide sufficient evidence to conclude that x is useful for predicting y. O B. Reject H...
Consider the following hypothesis test. p-value State your conclusion. Do not reject Ho, we cannot conclude...
 Consider the following hypothesis test. p-value State your conclusion. Do not reject Ho, we cannot conclude that σ12-022 Do not reject Ho, we can conclude that σ12 ng2 test statistic s
Do I reject the null and is there or not sufficient evidence? A company selling licenses...
 Do I reject the null and is
there or not sufficient evidence?
A company selling licenses for new e-commerce computer software advertises that firms using this software obtain, on average during the first year, a yield of 10% on their initial investments. A random sample of 10 of these franchises produced the yields shown below for the first year of operation. 6.8 9.9 11.4 8.4 12. 1 4 3 8.3 10.3 9.3 8.8 Assuming that population yields are normally distributed,...
Do I reject the null and is
there or not sufficient evidence?
A company selling licenses for new e-commerce computer software advertises that firms using this software obtain, on average during the first year, a yield of 10% on their initial investments. A random sample of 10 of these franchises produced the yields shown below for the first year of operation. 6.8 9.9 11.4 8.4 12. 1 4 3 8.3 10.3 9.3 8.8 Assuming that population yields are normally distributed,...
ill in the blank is 1. reject/do not reject 2. provide/does not provide and 3. less...
 ill in the blank is 1. reject/do not reject 2. provide/does not
provide and 3. less than, the same as, greater than, different
from
Suppose the mean height of women age 20 years or older in a certain country is 62.6 inches. One hundred randomly selected women in a certain city had a mean height o 61.0 inches. At the 5% significance level do the data provide sufficient evidence to conclude that the mean he t o wormer c differs...
ill in the blank is 1. reject/do not reject 2. provide/does not
provide and 3. less than, the same as, greater than, different
from
Suppose the mean height of women age 20 years or older in a certain country is 62.6 inches. One hundred randomly selected women in a certain city had a mean height o 61.0 inches. At the 5% significance level do the data provide sufficient evidence to conclude that the mean he t o wormer c differs...
(a) Test at the 0.05 level of significance whether there is sufficient evidence to conclude that...
(a) Test at the 0.05 level of significance whether there is sufficient evidence to conclude that the average salary of articling lawyers in Toronto exceeds $75,000. Use the critical value approach and show manually how the t-statistic is calculated. (b) Now show how you would calculate the p-value for the result in part (a). (c) Finally calculate manually a 95% 1-sided confidence interval for the average salary of an articling lawyer in Toronto. (d) Explain why the p-value and confidence...
fill in the blank is 1. is not/is 2. do not reject/reject and 3. provide/do not...
 fill in the blank is 1. is not/is 2. do not reject/reject and 3.
provide/do not provide
Question Help Preliminary data analyses indicate that the assumptions for using pooled t-procedures are satisfied. Independent random samples of 102 plots with cropland and 100 plots with grassland Cropland Grassland x1 14.33x215.86 1 4.62 82-4.74 n1 -102 n2 100 ded the given summary statistics for the number of species of bird. At the 1% significance level do the data provide sufficient evidence to...
fill in the blank is 1. is not/is 2. do not reject/reject and 3.
provide/do not provide
Question Help Preliminary data analyses indicate that the assumptions for using pooled t-procedures are satisfied. Independent random samples of 102 plots with cropland and 100 plots with grassland Cropland Grassland x1 14.33x215.86 1 4.62 82-4.74 n1 -102 n2 100 ded the given summary statistics for the number of species of bird. At the 1% significance level do the data provide sufficient evidence to...
Sample 2 11 n X Assume that both populations are normally distributed a) Test whether ,...
 Sample 2 11 n X Assume that both populations are normally distributed a) Test whether , at the = 0.01 level of significance for the given sample data b) Construct a 50% confidence interval about 4-12 Sample 1 19 5078 21 11.9 Click the icon to view the Student distribution table a) Perform a hypothesis test. Determine the null and alternative hypotheses O A HOM > B. Hy: H2 OB HM, H, H2 + C Họ P = H1 H1...
Consider the following hypothesis test. Hoius 12 H: > 12 A sample of 25 provided a...
 Consider the following hypothesis test. Hoius 12 H: > 12 A sample of 25 provided a sample mean x = 14 and a sample standard deviation s = 4.25. (a) Compute the value of the test statistic. (Round your answer to three decimal places.) (b) Use the t distribution table to compute a range for the p-value. O p-value > 0.200 O 0.100 < p-value < 0.200 O 0.050 < p-value < 0.100 O 0.025 < p-value < 0.050 O...
Consider the following hypothesis test. Ho: Moso H:Hd > 0 (a) The following data are from...
 Consider the following hypothesis test. Ho: Moso H:Hd > 0 (a) The following data are from matched samples taken from two populations. Compute the difference value for each element. (Use Population 1- Population 2.) Population Element 1 2 Difference 1 21 3 (b) Compute. (c) Compute the standard deviation Sd. (d) Conduct a hypothesis test using a = 0.05. Calculate the test statistic. (Round your answer to three decimal places.) Calculate the p-value. (Round your answer to four decimal places.)...
Consider the following hypothesis test. Ha: μ < 50 A sample of 36 is used. Identify the p-value and state your conclusion for each of the following sample results. Use -0.01. X (a) 49 and s-5.2 Fi...
 Consider the following hypothesis test. Ha: μ < 50 A sample of 36 is used. Identify the p-value and state your conclusion for each of the following sample results. Use -0.01. X (a) 49 and s-5.2 Find the value of the test statistic. (Round your answer to three decimal places.) Find the p-value. (Round your answer to four decimal places.) p-value State your conclusion. Do not reject Ho There is insufficient evidence to conclude that u 50 O Reject Ho....
fill in the blank is 1. reject/do not reject 2. provide/does not provide and 3. less...
 fill in the blank is 1. reject/do not reject 2. provide/does not
provide and 3. less than, the same as, greater than, different
from
Suppose a study reported that the average person watched 5.20 hours of television per day. A random sample of 15 people gave the number of hours of television watched per day shown. At the 1% significance level, do the data provide sufficient evidence to conclude that the amount of television watched per day last year by...
fill in the blank is 1. reject/do not reject 2. provide/does not
provide and 3. less than, the same as, greater than, different
from
Suppose a study reported that the average person watched 5.20 hours of television per day. A random sample of 15 people gave the number of hours of television watched per day shown. At the 1% significance level, do the data provide sufficient evidence to conclude that the amount of television watched per day last year by...
 Consider the following hypothesis test. p-value State your conclusion. Do not reject Ho, we cannot conclude that σ12-022 Do not reject Ho, we can conclude that σ12 ng2 test statistic s
 Do I reject the null and is
there or not sufficient evidence?
A company selling licenses for new e-commerce computer software advertises that firms using this software obtain, on average during the first year, a yield of 10% on their initial investments. A random sample of 10 of these franchises produced the yields shown below for the first year of operation. 6.8 9.9 11.4 8.4 12. 1 4 3 8.3 10.3 9.3 8.8 Assuming that population yields are normally distributed,...
Do I reject the null and is
there or not sufficient evidence?
A company selling licenses for new e-commerce computer software advertises that firms using this software obtain, on average during the first year, a yield of 10% on their initial investments. A random sample of 10 of these franchises produced the yields shown below for the first year of operation. 6.8 9.9 11.4 8.4 12. 1 4 3 8.3 10.3 9.3 8.8 Assuming that population yields are normally distributed,...
 ill in the blank is 1. reject/do not reject 2. provide/does not
provide and 3. less than, the same as, greater than, different
from
Suppose the mean height of women age 20 years or older in a certain country is 62.6 inches. One hundred randomly selected women in a certain city had a mean height o 61.0 inches. At the 5% significance level do the data provide sufficient evidence to conclude that the mean he t o wormer c differs...
ill in the blank is 1. reject/do not reject 2. provide/does not
provide and 3. less than, the same as, greater than, different
from
Suppose the mean height of women age 20 years or older in a certain country is 62.6 inches. One hundred randomly selected women in a certain city had a mean height o 61.0 inches. At the 5% significance level do the data provide sufficient evidence to conclude that the mean he t o wormer c differs...
 fill in the blank is 1. is not/is 2. do not reject/reject and 3.
provide/do not provide
Question Help Preliminary data analyses indicate that the assumptions for using pooled t-procedures are satisfied. Independent random samples of 102 plots with cropland and 100 plots with grassland Cropland Grassland x1 14.33x215.86 1 4.62 82-4.74 n1 -102 n2 100 ded the given summary statistics for the number of species of bird. At the 1% significance level do the data provide sufficient evidence to...
fill in the blank is 1. is not/is 2. do not reject/reject and 3.
provide/do not provide
Question Help Preliminary data analyses indicate that the assumptions for using pooled t-procedures are satisfied. Independent random samples of 102 plots with cropland and 100 plots with grassland Cropland Grassland x1 14.33x215.86 1 4.62 82-4.74 n1 -102 n2 100 ded the given summary statistics for the number of species of bird. At the 1% significance level do the data provide sufficient evidence to...
 Sample 2 11 n X Assume that both populations are normally distributed a) Test whether , at the = 0.01 level of significance for the given sample data b) Construct a 50% confidence interval about 4-12 Sample 1 19 5078 21 11.9 Click the icon to view the Student distribution table a) Perform a hypothesis test. Determine the null and alternative hypotheses O A HOM > B. Hy: H2 OB HM, H, H2 + C Họ P = H1 H1...
 Consider the following hypothesis test. Hoius 12 H: > 12 A sample of 25 provided a sample mean x = 14 and a sample standard deviation s = 4.25. (a) Compute the value of the test statistic. (Round your answer to three decimal places.) (b) Use the t distribution table to compute a range for the p-value. O p-value > 0.200 O 0.100 < p-value < 0.200 O 0.050 < p-value < 0.100 O 0.025 < p-value < 0.050 O...
 Consider the following hypothesis test. Ho: Moso H:Hd > 0 (a) The following data are from matched samples taken from two populations. Compute the difference value for each element. (Use Population 1- Population 2.) Population Element 1 2 Difference 1 21 3 (b) Compute. (c) Compute the standard deviation Sd. (d) Conduct a hypothesis test using a = 0.05. Calculate the test statistic. (Round your answer to three decimal places.) Calculate the p-value. (Round your answer to four decimal places.)...
 Consider the following hypothesis test. Ha: μ < 50 A sample of 36 is used. Identify the p-value and state your conclusion for each of the following sample results. Use -0.01. X (a) 49 and s-5.2 Find the value of the test statistic. (Round your answer to three decimal places.) Find the p-value. (Round your answer to four decimal places.) p-value State your conclusion. Do not reject Ho There is insufficient evidence to conclude that u 50 O Reject Ho....
 fill in the blank is 1. reject/do not reject 2. provide/does not
provide and 3. less than, the same as, greater than, different
from
Suppose a study reported that the average person watched 5.20 hours of television per day. A random sample of 15 people gave the number of hours of television watched per day shown. At the 1% significance level, do the data provide sufficient evidence to conclude that the amount of television watched per day last year by...
fill in the blank is 1. reject/do not reject 2. provide/does not
provide and 3. less than, the same as, greater than, different
from
Suppose a study reported that the average person watched 5.20 hours of television per day. A random sample of 15 people gave the number of hours of television watched per day shown. At the 1% significance level, do the data provide sufficient evidence to conclude that the amount of television watched per day last year by...
Most questions answered within 3 hours.
-
Riverbed Corp purchased a new blending machine for $3,050.01. It
paid $520.22 down and financed the...
asked 4 minutes ago -
A company faces an inverse demand curve of p = 17 − 2Q and its
cost...
asked 11 minutes ago -
The number of claims for lost luggage in a small city airport
averages 8 per day....
asked 12 minutes ago -
Your company wants to raise $11.0 million by issuing 30-year
zero-coupon bonds. If the yield to...
asked 15 minutes ago -
Radio waves, from your favorite radio station has a frequency of
( 89.3) MHz (megahertz). What...
asked 17 minutes ago -
In how many ways can one obtain at least three jacks in a six
card hand?...
asked 30 minutes ago -
Neal Nicely was driving on the parkway when he noticed two little
2. old ladies on...
asked 35 minutes ago -
The size of a movement ALONG a demand curve caused by a shift in
supply would...
asked 31 minutes ago -
1/Do you know how stem cells are retrieved ?
2 Does a zygote ( early fetus)...
asked 47 minutes ago -
A 2500 kg satellite is flying through empty space at speed vi =
20km/s. Find the...
asked 48 minutes ago -
Describe the four stages of extravasation
Describe the function of neutrophils
Compare innate and adaptive immunity...
asked 51 minutes ago -
A roads department wants to capitalize annual maintenance fees
of $5 million. It applies to the...
asked 55 minutes ago