
Homework Answers
As the reduction of oil and shift of SRAS curve is permanent so in the long run real GDP must be decreased. SO LRAS curve shifts to the left and new long-run equilibrium are formed where SRAS2=LRAS=AD
Add Answer to:
supply curve to shift leftward to SRAS, as shown in the graph at right. The economy is currently in short-run equilibrium at point E, and the reduction in supply is expected to be permanent. LRAS...
LRAS In the graph to the right illustrating the AD-AS model, assume the economy was in...
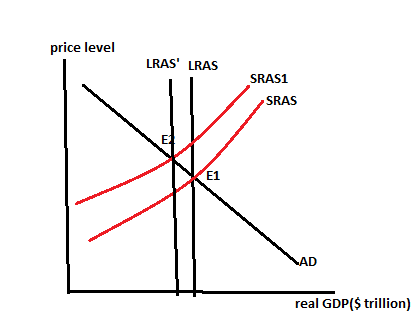
 LRAS In the graph to the right illustrating the AD-AS model, assume the economy was in equilibrium at point E1. Then, assume there was a decline in spending on new houses. Where does short-run equilibrium occur? Where does long-run equilibrium occur? 1.) Using the point drawing tool, plot the point that represents short-run equilibrium. Label this point E2. Price level, P. SRAS a SRAS2E1 2.) Using the point drawing tool, plot the point that represents long-run equilibrium. Label this point...
New LRAS, SRAS, and AD lines in the graph for the next year: Price level The...
 New LRAS, SRAS, and AD lines in the graph for the next
year:
Price level The following graph shows an economy in long-run macroeconomic equilibrium. All the usual assumptions of the dynamic demand and supply model hold Firms and workers expect there to be a decline in the inflation rate in the coming year LRAS, SRAS Use the line tool to draw three lines 1) the new LRAS, 2) the new SRAS, and 3) the new AD line in the...
New LRAS, SRAS, and AD lines in the graph for the next
year:
Price level The following graph shows an economy in long-run macroeconomic equilibrium. All the usual assumptions of the dynamic demand and supply model hold Firms and workers expect there to be a decline in the inflation rate in the coming year LRAS, SRAS Use the line tool to draw three lines 1) the new LRAS, 2) the new SRAS, and 3) the new AD line in the...
a) Provide a factor that would shift the long-run aggregate supply (LRAS) curve to the right....
a) Provide a factor that would shift the long-run aggregate supply (LRAS) curve to the right. What does this shift in LRAS imply for aggregate output? Use the Aggregate Demand and Supply model to illustrate this event. Make sure you properly label all the axes and curves. (You only need to draw a shift in LRAS curve, no need to draw other curves). b) Provide a factor that would shift the short-run aggregate supply (SRAS) curve upward (and to the...
The figure below depicts the aggregate demand curve (AD), the short-run aggregate supply curve (SRAS), and the long-run aggregate supply curve (LRAS) for the United States. The economy is initially at long-run equilibrium, at point A.
 The figure below depicts the aggregate demand curve (AD), the short-run aggregate supply curve (SRAS), and the long-run aggregate supply curve (LRAS) for the United States. The economy is initially at long-run equilibrium, at point A.One of the most contentious issues among economists involves the economy’s adjustment to long-run equilibrium. Some economists believe that adjustment can and should occur naturally. This group, the classical economists, stress the importance of aggregate supply. Others see the return to long-run equilibrium as an...
The figure to the right shows an economy in an initial long-run equilibrium at point LRAS,...
 The figure to the right shows an economy in an initial long-run equilibrium at point LRAS, aUsing the line drawing fool, show how, if at all the equilibrium real GDP and the long-run equilibrium price level are affected by a reduction in the quantity of money in circulation Properly label this line. Carefully follow the instructions above, and only draw the required objects b. According to your graph, the equilibrium price level real GDP while the equilibrium Price Level RGDP...
The graph to the right shows a situation in which the economy was in equilibrium at potential GDP (at point A) when the...
 The graph to the right shows a situation in which the economy was in equilibrium at potential GDP (at point A) when the demand for housing sharply declined. What actions can the federal government take to move the economy back to potential GDP? LRAS SRAS SRAS O A. Increase the money supply. B. Increase government spending or decrease taxes. O C. Decrease government spending or increase taxes. O D. Both A and B. Price level 1.) Use the line drawing...
Using aggregate demand (AD), short-run aggregate supply (SRAS) and long-run aggregate supply (LRAS) curves
Question 1: AD-SRAS-LRAS Model Using aggregate demand (AD), short-run aggregate supply (SRAS) and long-run aggregate supply (LRAS) curves, graphically illustrate the effect of an increase in the money supply on output and prices in the short and long run. Assume that the economy is initially in long run equilibrium at the potential output level and prices are fixed in the short-run. In your graph, label "A" for the initial equilibrium, "B' for the short-run equilibrium, and "C" for the long-run equilibrium.
The figure below depicts the aggregate demand curve (AD) and the long-run aggregate supply curve (LRAS) for the United States. The economy is initially at long-run equilibrium, at point A.
 The figure below depicts the aggregate demand curve (AD) and the long-run aggregate supply curve (LRAS) for the United States. The economy is initially at long-run equilibrium, at point A.One of the most contentious issues among economists involves the economy’s adjustment to long-run equilibrium. Some economists believe that adjustment can and should occur naturally. This group, the classical economists, stresses the importance of aggregate supply. Others see the return to long-run equilibrium as an adjustment that occurs unpredictably and often...
The assignment is about drawing the graph of AD, SRAS and LRAS and writing down what...
The assignment is about drawing the graph of AD, SRAS and LRAS and writing down what would happen under the condition "decrease in personal income taxes" Need to write down everything that happens by following the seven steps: 1) What would happen under the condition? (Whether AD, SRAS, or LRAS would change? And in which direction the curve would shift?) 2) Where is the new short-run equilibrium? (You need to mark the point in the graph.) 3) What changed in...
The figure to the right shows an economy in an initial long-run equilibrium at point A...
 The figure to the right shows an economy in an initial long-run equilibrium at point A a Using the line drawing tool show how, if at all the equilibrium real GDP and the long run equilibrium price level are affected by a decrease in the value of the home currency in terms of the currencies of other nations Properly label this line Carefully follow the instructions above and only draw the required objects b. According to your graph, the equilibrium...
 LRAS In the graph to the right illustrating the AD-AS model, assume the economy was in equilibrium at point E1. Then, assume there was a decline in spending on new houses. Where does short-run equilibrium occur? Where does long-run equilibrium occur? 1.) Using the point drawing tool, plot the point that represents short-run equilibrium. Label this point E2. Price level, P. SRAS a SRAS2E1 2.) Using the point drawing tool, plot the point that represents long-run equilibrium. Label this point...
 New LRAS, SRAS, and AD lines in the graph for the next
year:
Price level The following graph shows an economy in long-run macroeconomic equilibrium. All the usual assumptions of the dynamic demand and supply model hold Firms and workers expect there to be a decline in the inflation rate in the coming year LRAS, SRAS Use the line tool to draw three lines 1) the new LRAS, 2) the new SRAS, and 3) the new AD line in the...
New LRAS, SRAS, and AD lines in the graph for the next
year:
Price level The following graph shows an economy in long-run macroeconomic equilibrium. All the usual assumptions of the dynamic demand and supply model hold Firms and workers expect there to be a decline in the inflation rate in the coming year LRAS, SRAS Use the line tool to draw three lines 1) the new LRAS, 2) the new SRAS, and 3) the new AD line in the...
 The figure to the right shows an economy in an initial long-run equilibrium at point LRAS, aUsing the line drawing fool, show how, if at all the equilibrium real GDP and the long-run equilibrium price level are affected by a reduction in the quantity of money in circulation Properly label this line. Carefully follow the instructions above, and only draw the required objects b. According to your graph, the equilibrium price level real GDP while the equilibrium Price Level RGDP...
 The graph to the right shows a situation in which the economy was in equilibrium at potential GDP (at point A) when the demand for housing sharply declined. What actions can the federal government take to move the economy back to potential GDP? LRAS SRAS SRAS O A. Increase the money supply. B. Increase government spending or decrease taxes. O C. Decrease government spending or increase taxes. O D. Both A and B. Price level 1.) Use the line drawing...
 The figure to the right shows an economy in an initial long-run equilibrium at point A a Using the line drawing tool show how, if at all the equilibrium real GDP and the long run equilibrium price level are affected by a decrease in the value of the home currency in terms of the currencies of other nations Properly label this line Carefully follow the instructions above and only draw the required objects b. According to your graph, the equilibrium...
Most questions answered within 3 hours.
-
1. Why are the advantages and disadvantages of object-oriented
databases? 2. What are data marts? How...
asked 8 minutes ago -
A Porsche challenges a Honda to a 4.00×10²m race. Because the
Porsche's acceleration of 3.30 m/s2...
asked 9 minutes ago -
A sample of C3H8 has 1.60×1024 H atoms.
How many carbon atoms does the sample contain?...
asked 1 hour ago -
How many unique codes are possibly formed from two characters,
where the first character can be...
asked 31 minutes ago -
A concentration cell is built based on the reaction:
2H+ + 2e- ----> H2
The pH...
asked 27 minutes ago -
what is the ph of the following solutions?
150 g NH4CI dissolved into 10.0 mL of...
asked 38 minutes ago -
A projectile is launched with an initial speed of 40 m/s at an
angle of 25°...
asked 21 minutes ago -
1. Using a function, display the customer who has the highest
credit limit. Display the customer...
asked 29 minutes ago -
A spatially uniform electric field varies in time according
to E = Eo + 3000 t,...
asked 55 minutes ago -
An electric power station that operates at 25 kV and uses a 20:1
step-up ideal transformer...
asked 48 minutes ago -
1. If 0.02% of a 0.6 M weak acid ionizes in a solution, what is
the...
asked 35 minutes ago -
The College of Business at Northeast College is accumulating
data as a first step in the...
asked 40 minutes ago