
Homework Answers


Add Answer to:
1. A. Suppose in an economy, there is an exogenous fall in investment spending due to the burst of a housing bubble. Answer the following questions using the IS-LM-FX model. Which schedule shifts...
IS-LM-FX Model and Stabilization Policy Suppose the fiscal authority of an economy implements expansionary policy. Specifically,...
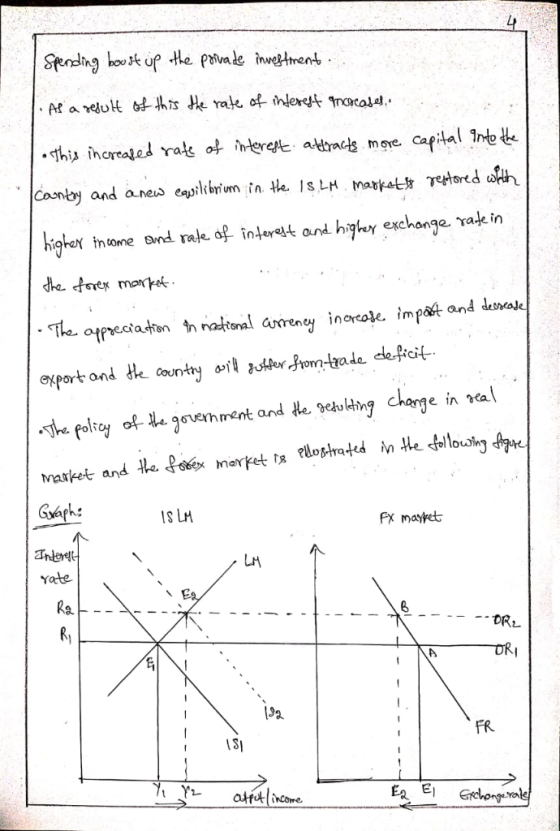
IS-LM-FX Model and Stabilization Policy Suppose the fiscal authority of an economy implements expansionary policy. Specifically, the government increases its spending. Consider the graphical illustration of the IS-LM-FX model and the analysis of the policy change, and answer the following questions comparing the initial equilibrium before any change was implemented to the equilibrium that prevails after the expansionary fiscal policy is implemented. a) What happens to the consumer spending, why? explain. b) What happens to the investment spending, why? explain....
IS-LM-FX Model with Floating Exchange Rate [20 points 3 For each of the following situations use...
 IS-LM-FX Model with Floating Exchange Rate [20 points 3 For each of the following situations use the IS-LM-FX model to illustrate, first, the effects of the temporary shock and then the policy response. (Note: Assume the central bank responds by using monetary policy to stabilize output (ie. to keep it at the initial equilibrium)) Label A the initial equilibrium, B the short-run equilibrium without policy response, and C the equilibrium after the response of the central bank. For each case,...
Question #4: IS-LM Model: Change in Fiscal Policy (a) Suppose Congress had announced that they were...
 Question
#4: IS-LM Model: Change in Fiscal Policy (a) Suppose Congress had
announced that they were going to increase government spending to G
= 400. Assume that (M/P)Sreturns to 1600. Now the set of equations
are the following: C = 200 + 0.25YDI = 150 + 0.25Y –1000i T = 200 G
= 400(M/P)S= 1600(M/P)d= 2Y –8000i Calculate the new level of
equilibrium interest rate (i) and equilibrium output (Y).(b)
Calculate the new levels of consumption (C) and investment (I)...
Question
#4: IS-LM Model: Change in Fiscal Policy (a) Suppose Congress had
announced that they were going to increase government spending to G
= 400. Assume that (M/P)Sreturns to 1600. Now the set of equations
are the following: C = 200 + 0.25YDI = 150 + 0.25Y –1000i T = 200 G
= 400(M/P)S= 1600(M/P)d= 2Y –8000i Calculate the new level of
equilibrium interest rate (i) and equilibrium output (Y).(b)
Calculate the new levels of consumption (C) and investment (I)...
1. Consider the following numerical example of the IS-LM model: C = 100 + 0.3YD I...
1. Consider the following numerical example of the IS-LM model: C = 100 + 0.3YD I = 150 + 0.2Y - 1000i T = 100 G = 200 i = .01 (M/P)s = 1200 (M/P)d = 2Y - 4000i a. Find the equation for aggregate demand (Y). b. Derive the IS relation. c. Derive the LM relation if the central bank sets an interest rate of 1%. d. Solve for the equilibrium values of output, interest rate, C and I....
Use the IS-LM-PC model with an inflation-targeting central bank to answer the following short answer questions....
Use the IS-LM-PC model with an inflation-targeting central bank to answer the following short answer questions. In this question, you don’t need to explain or show the graph. But, when you’re not sure of the answer, don’t guess; instead, use the IS-LM-PC model to help you. An increase in the risk premium. Inflationary expectations are adaptive. i. What happens to inflation over time? ii. What does the central bank need to do to return to the medium-run equilibrium?
MacroEconomics - Can someone answer these questions please? 17. Use the IS-LM model to answer the following questions....
 MacroEconomics - Can someone answer these questions please?
17. Use the IS-LM model to answer the following questions. In this framework, investment depends on the interest rate and output. a. Suppose that the US federal government tries to cut its fiscal deficit. In an IS-LM diagram, show the effect of the cut in fiscal deficit on output and the interest rate. b. How will the reduction of fiscal deficit affect consumption, investment and private saving? Explain clearly.
MacroEconomics - Can someone answer these questions please?
17. Use the IS-LM model to answer the following questions. In this framework, investment depends on the interest rate and output. a. Suppose that the US federal government tries to cut its fiscal deficit. In an IS-LM diagram, show the effect of the cut in fiscal deficit on output and the interest rate. b. How will the reduction of fiscal deficit affect consumption, investment and private saving? Explain clearly.
Suppose the economy is operating at full potential in the following IS-LM-PC model: C 200+0.25*Y ...
 Suppose the economy is operating at full potential in the following IS-LM-PC model: C 200+0.25*Y I-150 0.25*Y-1000 i G = 150 T-200 i-0.05 a) Solve for the equilibrium level of output. What is the level of potential output? b) Solve for the equilibrium values of C and I c) Suppose in period t+1 there is an increase in consumer confidence to 0.5 and an increase in taxes to 300. Solve for the new equilibrium levels of Y, C and I...
Just e) f) and g) if possible please Question 5: The IS-LM model Consider the following...
 Just e) f) and g) if possible please
Question 5: The IS-LM model Consider the following IS-LM model: Consumption: C = 200 +0.25YD Investment: I=150 + 0.25Y - 10001 Government spending: G=250 Taxes: T=200 Money demand: L(i,Y)-2Y - 8000 Money supply: Ms /P=1600 (a) Derive the equation for the IS curve. (Hint: You want an equation with Y on the lefthand side and all else on the right) (b) Derive the equation for the LM curve. (Hint: It will be...
Just e) f) and g) if possible please
Question 5: The IS-LM model Consider the following IS-LM model: Consumption: C = 200 +0.25YD Investment: I=150 + 0.25Y - 10001 Government spending: G=250 Taxes: T=200 Money demand: L(i,Y)-2Y - 8000 Money supply: Ms /P=1600 (a) Derive the equation for the IS curve. (Hint: You want an equation with Y on the lefthand side and all else on the right) (b) Derive the equation for the LM curve. (Hint: It will be...
Q1140 points] Briefly, but not unsatisfactorily, answer the following questions. a) Using the Key...
 Q1140 points] Briefly, but not unsatisfactorily, answer the following questions. a) Using the Keynesian cross model where the goods market equilibrium is determined and analyzed, graphically derive the IS curve, and explain each step. Explain what the equilibrium in the goods market implies for the IS curve, i.e., why is the IS curve downward sloping. Also, explain what causes shifts in the IS curve. b) First, based on the analysis of the financial market equilibrium, graphically derive the LM curve....
Consult exhibit 2 then, answers the following questions: 1/ Using the IS-LM model, how does the...
 Consult exhibit 2 then, answers the following questions: 1/ Using the IS-LM model, how does the spending hypothesis explain the great depression 2 2/ When relying on the IS-LM model, economists often reach the conclusion that the "Money hypothesis" is not so relevant to explain the great depression. Explain why. Exhibit 2: TABLE 11-2 What Happened During the Great Depression? Consumption Unemployment Rate (1) Real GNP 23 1930 2036 1835 1695 144.2 141.5 1396 130.4 126.1 1931 1932 1933 1934...
 IS-LM-FX Model with Floating Exchange Rate [20 points 3 For each of the following situations use the IS-LM-FX model to illustrate, first, the effects of the temporary shock and then the policy response. (Note: Assume the central bank responds by using monetary policy to stabilize output (ie. to keep it at the initial equilibrium)) Label A the initial equilibrium, B the short-run equilibrium without policy response, and C the equilibrium after the response of the central bank. For each case,...
 Question
#4: IS-LM Model: Change in Fiscal Policy (a) Suppose Congress had
announced that they were going to increase government spending to G
= 400. Assume that (M/P)Sreturns to 1600. Now the set of equations
are the following: C = 200 + 0.25YDI = 150 + 0.25Y –1000i T = 200 G
= 400(M/P)S= 1600(M/P)d= 2Y –8000i Calculate the new level of
equilibrium interest rate (i) and equilibrium output (Y).(b)
Calculate the new levels of consumption (C) and investment (I)...
Question
#4: IS-LM Model: Change in Fiscal Policy (a) Suppose Congress had
announced that they were going to increase government spending to G
= 400. Assume that (M/P)Sreturns to 1600. Now the set of equations
are the following: C = 200 + 0.25YDI = 150 + 0.25Y –1000i T = 200 G
= 400(M/P)S= 1600(M/P)d= 2Y –8000i Calculate the new level of
equilibrium interest rate (i) and equilibrium output (Y).(b)
Calculate the new levels of consumption (C) and investment (I)...
 MacroEconomics - Can someone answer these questions please?
17. Use the IS-LM model to answer the following questions. In this framework, investment depends on the interest rate and output. a. Suppose that the US federal government tries to cut its fiscal deficit. In an IS-LM diagram, show the effect of the cut in fiscal deficit on output and the interest rate. b. How will the reduction of fiscal deficit affect consumption, investment and private saving? Explain clearly.
MacroEconomics - Can someone answer these questions please?
17. Use the IS-LM model to answer the following questions. In this framework, investment depends on the interest rate and output. a. Suppose that the US federal government tries to cut its fiscal deficit. In an IS-LM diagram, show the effect of the cut in fiscal deficit on output and the interest rate. b. How will the reduction of fiscal deficit affect consumption, investment and private saving? Explain clearly.
 Suppose the economy is operating at full potential in the following IS-LM-PC model: C 200+0.25*Y I-150 0.25*Y-1000 i G = 150 T-200 i-0.05 a) Solve for the equilibrium level of output. What is the level of potential output? b) Solve for the equilibrium values of C and I c) Suppose in period t+1 there is an increase in consumer confidence to 0.5 and an increase in taxes to 300. Solve for the new equilibrium levels of Y, C and I...
 Just e) f) and g) if possible please
Question 5: The IS-LM model Consider the following IS-LM model: Consumption: C = 200 +0.25YD Investment: I=150 + 0.25Y - 10001 Government spending: G=250 Taxes: T=200 Money demand: L(i,Y)-2Y - 8000 Money supply: Ms /P=1600 (a) Derive the equation for the IS curve. (Hint: You want an equation with Y on the lefthand side and all else on the right) (b) Derive the equation for the LM curve. (Hint: It will be...
Just e) f) and g) if possible please
Question 5: The IS-LM model Consider the following IS-LM model: Consumption: C = 200 +0.25YD Investment: I=150 + 0.25Y - 10001 Government spending: G=250 Taxes: T=200 Money demand: L(i,Y)-2Y - 8000 Money supply: Ms /P=1600 (a) Derive the equation for the IS curve. (Hint: You want an equation with Y on the lefthand side and all else on the right) (b) Derive the equation for the LM curve. (Hint: It will be...
 Q1140 points] Briefly, but not unsatisfactorily, answer the following questions. a) Using the Keynesian cross model where the goods market equilibrium is determined and analyzed, graphically derive the IS curve, and explain each step. Explain what the equilibrium in the goods market implies for the IS curve, i.e., why is the IS curve downward sloping. Also, explain what causes shifts in the IS curve. b) First, based on the analysis of the financial market equilibrium, graphically derive the LM curve....
 Consult exhibit 2 then, answers the following questions: 1/ Using the IS-LM model, how does the spending hypothesis explain the great depression 2 2/ When relying on the IS-LM model, economists often reach the conclusion that the "Money hypothesis" is not so relevant to explain the great depression. Explain why. Exhibit 2: TABLE 11-2 What Happened During the Great Depression? Consumption Unemployment Rate (1) Real GNP 23 1930 2036 1835 1695 144.2 141.5 1396 130.4 126.1 1931 1932 1933 1934...
Most questions answered within 3 hours.
-
a
1500 kg car accelerates from 0 to 25 m / s in 21.0s. How much...
asked 28 minutes ago -
Calculate the molarity of each of the following solutions:
(a) 30.5 g of ethanol (C2H5OH) in...
asked 23 minutes ago -
1 Refer to the build-borrow-or-buy framework as a decision tree
for the Adidas company. Identify a...
asked 50 minutes ago -
Problem 2: The Problem of Social Cost. A Rancher and Farmer live
side-by-side to each other....
asked 2 hours ago -
a uniform bar of weight 40N is 4 meter long. weights
on 60N and 100N are...
asked 1 hour ago -
Define Diet counceling? What are the
responsibilities of a counselor?
asked 3 hours ago -
Hey im just confused about how to put the ' A angle n' and ' S...
asked 3 hours ago -
A short essay about the WSJ article on Oreo versus Hydrox.
asked 3 hours ago -
##8. A program contains the following function definition:
##def cube(num):
##return num * num * num...
asked 3 hours ago -
find the value z of a standard Normal variable that satisfies
each of the given conditions....
asked 4 hours ago -
"banana".find('z')
Out[22]: -1
why is this -1
python 3.7
asked 3 hours ago -
Ilegal Consideration Marna Balin was involved in two automobile
accidents in which she suffered severe injures.She...
asked 4 hours ago