This question should be solved by MATLAB. - Generate an analog signal. (This should be an audio, any audio can be used.) - Analyze frequency spectrum of this analog signal. - Modulate it. (AM Modulati...
This question should be solved by MATLAB.
- Generate an analog signal. (This should be an audio, any audio can be used.)
- Analyze frequency spectrum of this analog signal.
- Modulate it. (AM Modulation can be used)
- Send the modulated signal over a wireless channel. (Before sending the signal, a noise should be added.)
Thank you already for your help!
Homework Answers
Solution:
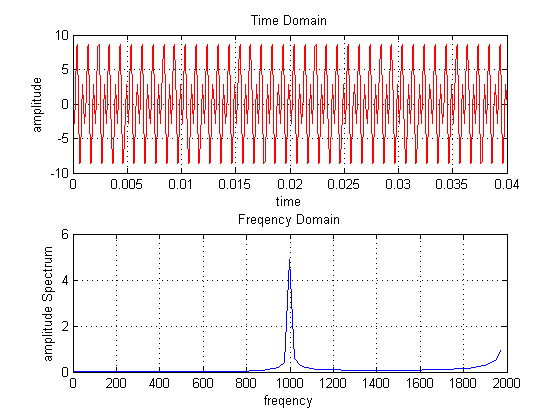
(a)the analog audio signal contains three frequency components 1KHz,5KHz,8KHz
%%--------------------- MATLAB code -------------------------%%
dt=1/100;
dt=1/10000; %sampling rate
et=4e-2; %end of the interval
t=0:dt:et; %sampling range
%frequencies
f1=1e3;f2=2e3;f3=3e3;
y=5*sin(2*pi*f1*t)+2*sin(2*pi*f2*t)+6*sin(2*pi*f3*t); % sample the
signal
%plot the time domain
subplot(2,1,1); %first of two plot
plot(t,y,'r');grid on; %plot with grid
axis([0 et -10 10]); %adjust scaling
xlabel('time') %time axis
ylabel('amplitude') %freqency axis
title('Time Domain')
%%(b)
%Analysis in Frequency spectrum
Y=fft(y); %compute the fourier transform
n=size(y,2)/2; %second half are complex conjugate
amp_spectrum=abs(Y)/n; %absolute value and normalize
subplot(2,1,2); %second of two plots
freq=(0:79)/(2*n*dt); % abscissa viewing window
plot(freq,amp_spectrum(1:80)); %plot amplitude spectrum
grid on;
xlabel('freqency') %x label frequency
ylabel('amplitude Spectrum') %y axis amplitude spectrum
title('Freqency Domain')
%%-------------------------- END --------------------------%%
plot:
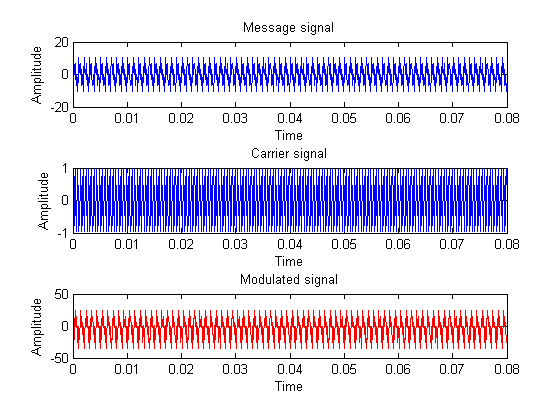
(c)modulating the message signal
%%--------------------------- MATLAB Code ---------------------------%%
Ac=input('enter carrier signal amplitude:');
%Am=input('enter message signal amplitude');
fc=input('enter carrier frequency more then 6k:');
%fm=input('enter message frequency');% fm<fc
m=input('enter modulation index:');
T=input('enter time period:');
dt=1/100;
dt=1/10000; %sampling rate
et=T*1e-2; %end of the interval
t=0:dt:et; %sampling range
%t1=linspace(0,t,1000);
%y1=sin(2*pi*fm*t1); % message signal
%frequencies
f1=1e3;f2=2e3;f3=3e3;
y1=5*sin(2*pi*f1*t)+2*sin(2*pi*f2*t)+6*sin(2*pi*f3*t); % sample the
signal
y2=sin(2*pi*fc*t); % carrier signal
eq=(1+m.*y1).*(Ac.*y2);
subplot(311);
plot(t,y1);
xlabel('Time');
ylabel('Amplitude');
title('Message signal')
subplot(312)
plot(t,y2);
xlabel('Time');
ylabel('Amplitude');
title('Carrier signal');
subplot(313);
%plot(t,eq);
plot(t,eq,'r');
xlabel('Time');
ylabel('Amplitude');
title('Modulated signal');
%%----------------------------------- END -------------------------------%%
plot:
Add Answer to:
This question should be solved by MATLAB. - Generate an analog signal. (This should be an audio, any audio can be used.) - Analyze frequency spectrum of this analog signal. - Modulate it. (AM Modulati...
2. An audio frequency signal 10sin2π500t) is used to amplitude modulate a carrier of 50sin(2π 100...
 Please solve whole this problem and be clear when you write by
your hand.
2. An audio frequency signal 10sin2π500t) is used to amplitude modulate a carrier of 50sin(2π 100000t). Assume modulation index-02. Find: a) the general AM equation b) Sketch the spectrum resulting AM [S(] c) Sideband frequencies d) Amplitude of each sideband e) Bandwidth required f) Efficiency of AM wave
2. An audio frequency signal 10sin2π500t) is used to amplitude modulate a carrier of 50sin(2π 100000t). Assume modulation...
Please solve whole this problem and be clear when you write by
your hand.
2. An audio frequency signal 10sin2π500t) is used to amplitude modulate a carrier of 50sin(2π 100000t). Assume modulation index-02. Find: a) the general AM equation b) Sketch the spectrum resulting AM [S(] c) Sideband frequencies d) Amplitude of each sideband e) Bandwidth required f) Efficiency of AM wave
2. An audio frequency signal 10sin2π500t) is used to amplitude modulate a carrier of 50sin(2π 100000t). Assume modulation...
below is used to modulate a carrier to generate the AM signal yt) (Am()) cos(1000t) The periodic signal m() shown a) The power efficiency of the system is measured to be 1 () The type of AM modula...
 below is used to modulate a carrier to generate the AM signal yt) (Am()) cos(1000t) The periodic signal m() shown a) The power efficiency of the system is measured to be 1 () The type of AM modulation, i.e. SSB, DSBSC, (i) The constant A. (ili) The modulation index 1/13. Determine DSB with carrier enit -3 b) An angle modulated signal is given by d(t-2 cos (2n1061+ sin 2 1000). Find i) The carrier frequency. ii) The baseband signal bandwidth....
1 Question 5 pts What is the coherent demodulation? Question 1 pts What kind AM modulation can tr...
 1 Question 5 pts What is the coherent demodulation? Question 1 pts What kind AM modulation can transmit the information signal in maximum power if the carrier signal power is fixed? Question 1 pts What kind AM modulation has the narrowest signal band to transmit the same information signal? Question 10 pts Search om Internet. What is the VSB, which is a kind of AM modulation used in TV means? at are the advantages and disadvantages according to the information...
can someone help me do this and maybe also the picture of the scope explain how you get it. thankyou! Frequency-sh...
 can someone help me do this and maybe also the picture of the
scope explain how you get it. thankyou!
Frequency-shift keying (FSK) and Phase-shift keying (PSK) Two other modulation schemes are the phase-shift keying (PSK) and the frequency-shift keying (FSK). These are illustrated in Figure 8 b and c respectively. In phase-shift keying the carrier signal changes phase by a radians when the digital signal changes values. In frequency-shift keying a 0 is transmitted at a different carrier frequency...
can someone help me do this and maybe also the picture of the
scope explain how you get it. thankyou!
Frequency-shift keying (FSK) and Phase-shift keying (PSK) Two other modulation schemes are the phase-shift keying (PSK) and the frequency-shift keying (FSK). These are illustrated in Figure 8 b and c respectively. In phase-shift keying the carrier signal changes phase by a radians when the digital signal changes values. In frequency-shift keying a 0 is transmitted at a different carrier frequency...
 Please solve whole this problem and be clear when you write by
your hand.
2. An audio frequency signal 10sin2π500t) is used to amplitude modulate a carrier of 50sin(2π 100000t). Assume modulation index-02. Find: a) the general AM equation b) Sketch the spectrum resulting AM [S(] c) Sideband frequencies d) Amplitude of each sideband e) Bandwidth required f) Efficiency of AM wave
2. An audio frequency signal 10sin2π500t) is used to amplitude modulate a carrier of 50sin(2π 100000t). Assume modulation...
Please solve whole this problem and be clear when you write by
your hand.
2. An audio frequency signal 10sin2π500t) is used to amplitude modulate a carrier of 50sin(2π 100000t). Assume modulation index-02. Find: a) the general AM equation b) Sketch the spectrum resulting AM [S(] c) Sideband frequencies d) Amplitude of each sideband e) Bandwidth required f) Efficiency of AM wave
2. An audio frequency signal 10sin2π500t) is used to amplitude modulate a carrier of 50sin(2π 100000t). Assume modulation...
 below is used to modulate a carrier to generate the AM signal yt) (Am()) cos(1000t) The periodic signal m() shown a) The power efficiency of the system is measured to be 1 () The type of AM modulation, i.e. SSB, DSBSC, (i) The constant A. (ili) The modulation index 1/13. Determine DSB with carrier enit -3 b) An angle modulated signal is given by d(t-2 cos (2n1061+ sin 2 1000). Find i) The carrier frequency. ii) The baseband signal bandwidth....
 1 Question 5 pts What is the coherent demodulation? Question 1 pts What kind AM modulation can transmit the information signal in maximum power if the carrier signal power is fixed? Question 1 pts What kind AM modulation has the narrowest signal band to transmit the same information signal? Question 10 pts Search om Internet. What is the VSB, which is a kind of AM modulation used in TV means? at are the advantages and disadvantages according to the information...
 can someone help me do this and maybe also the picture of the
scope explain how you get it. thankyou!
Frequency-shift keying (FSK) and Phase-shift keying (PSK) Two other modulation schemes are the phase-shift keying (PSK) and the frequency-shift keying (FSK). These are illustrated in Figure 8 b and c respectively. In phase-shift keying the carrier signal changes phase by a radians when the digital signal changes values. In frequency-shift keying a 0 is transmitted at a different carrier frequency...
can someone help me do this and maybe also the picture of the
scope explain how you get it. thankyou!
Frequency-shift keying (FSK) and Phase-shift keying (PSK) Two other modulation schemes are the phase-shift keying (PSK) and the frequency-shift keying (FSK). These are illustrated in Figure 8 b and c respectively. In phase-shift keying the carrier signal changes phase by a radians when the digital signal changes values. In frequency-shift keying a 0 is transmitted at a different carrier frequency...
Most questions answered within 3 hours.
-
A regression equation that describes the relationship between
the amount of the bill ($) at a...
asked 45 minutes ago -
exercise on VSEPR and molecular structrue.
octahedral
SeCl62-
TeCl62-
ClF62-
distorted
SeF62–
IF6–
asked 1 hour ago -
284 mL of a 0.52 M potassium hydroxide solution is added to 467
mL of a...
asked 1 hour ago -
Little’s Law: Val d’Costa is a world famous ski village in the
French Alps. Because of...
asked 2 hours ago -
Find the absolute error D for the calculation if A + B/C=D A=
9.4 +/- 0.4...
asked 2 hours ago -
New Air Heating and Cooling, manufactures furnaces and central
air units. The company pride itself on...
asked 2 hours ago -
A coach uses a new technique to train gymnasts. Seven
gymnasts were randomly selected and their...
asked 4 hours ago -
While rotating the tires on your car you notice a rock [mass =
0.1 Kg] stuck...
asked 6 hours ago -
Using MARS simulator, write MIPS programs according to
the following scenarios: Receive a positive integer number...
asked 8 hours ago -
An object in front of a concave mirror has a real image that is
11.5 cm...
asked 8 hours ago -
Consider the reaction, C3 H8 + O2 --> CO2 + H2O. How many
moles of O2...
asked 10 hours ago -
You and your opponent both roll a fair die. If you both roll the
same number,...
asked 10 hours ago