


2. 120 100 80 60 40 20 110-120-130 140 150 160 170 3. 120 100 80 60 40 20 110一一120一一130 -149 130-100-170
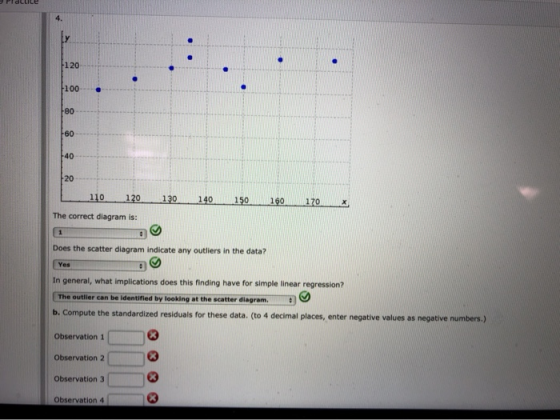
120 100 80 60 40 20 130-140-150一一160一一1zo___ 110 120 The correct diagram is: Does the scatter diagram indicate any outliers in the data? In general, what implications does this finding have for simple linear regression? The outlier can be identified by looking at the scatter diagram. b. Compute the standardized residuals for these data. (to 4 decimal places, enter negative values as negative numbers.) Observation 1 Observation 2 Observation 3 Observation 4
Practice Observation 5 Observation 6 Observation 7 Do the data include any outliers? Yes, there appears to be an outlier. Which of the following plots the standardized residuals against i 1. StandardizedResidual Fitted Value 195 110 115 920 125 130 135 140 145 2. StandardizedResidual
2. StandardizedResidual 193 119 113 0131 13 14 14 Fitted Vel 3. Standardzed Residual Value
14.9 Practice 4. StandardizedResidual The correct diagram is: Does this plot reveal any outliers? Yes Hide Feedback Partially Correct
Homework Answers
Using Excel
data -> data analysis -> regression
click on standard residuals
b)
| Observation | Standard Residuals |
| 1 | 2.1346 |
| 2 | -0.8997 |
| 3 | 0.1383 |
| 4 | -0.3857 |
| 5 | -0.5654 |
| 6 | -0.0414 |
| 7 | -0.3807 |
c)
Add Answer to:
eBook Video Consider the following data for two variables, z and y. i 135 110 130 145 175 160 120 i 145 100 120 120 130 130 110 a. Consider the four scatter diagrams below. 1. 120 100 80 ...
r 170 160+ 150 140+ 130 - 120 110 100+ 90 Supply 80- 70 60+ SO...
 r 170 160+ 150 140+ 130 - 120 110 100+ 90 Supply 80- 70 60+ SO 40- Demand 30 20- 10- 2 4 6 8 10 12 14 16 18 20 22 24 26 28 30 Quantity of Loanable Funds Suppose the market for loanable funds opened up to international borrowers and savers. Further suppose that the real interest rate worldwide is 120 basis points (100 basis points = 1%). Would the gains from trade end up with the households...
The mass spectrum of 3-bromopropanoic acid is shown below. Four peaks are labeled with A, B,...
 The mass spectrum of 3-bromopropanoic acid is shown below. Four peaks are labeled with A, B, C, and D. Select the label for the base peak(s). 45 55 18 26 on 10 20 30 40 50 60 70 80 90 100 MIZ 110 120 130 140 150 160 170 The mass spectrum of 3-bromopropanoic acid is shown below. Four peaks are labeled with A, B, C, and D. Select the label for the M peak(s) (unfragmented parent). 135 27 45...
Suggest a composition for the halogen compound whose mass spectrum is shown below and assign the labeled peaks. 127 100 173 160 158 162 25 48 TITTHTT 160 170 91 208 79 35 160 173 30 40 50 60 70 80 90...
 Suggest a composition for the halogen compound whose mass
spectrum is shown below and assign the labeled peaks.
127 100 173 160 158 162 25 48 TITTHTT 160 170 91 208 79 35 160 173 30 40 50 60 70 80 90 100 110 120 130 140 150 160 170 180 190 200 210 m/z
127 100 173 160 158 162 25 48 TITTHTT 160 170 91 208 79 35 160 173 30 40 50 60 70 80 90 100...
Suggest a composition for the halogen compound whose mass
spectrum is shown below and assign the labeled peaks.
127 100 173 160 158 162 25 48 TITTHTT 160 170 91 208 79 35 160 173 30 40 50 60 70 80 90 100 110 120 130 140 150 160 170 180 190 200 210 m/z
127 100 173 160 158 162 25 48 TITTHTT 160 170 91 208 79 35 160 173 30 40 50 60 70 80 90 100...
20 30 40 50 60 70 80 99 100 110 120 130 140 150 160 170...
 20 30 40 50 60 70 80 99 100 110 120 130 140 150 160 170 180 190 259 260 270 280 290 300 310 320 330 340 350 360 370 380 390 400 410 420 430 490 500 51 52 53 545 QUESTION 47 Ben bought a house for $500,000. The bank will make a mortgage loan with 10% down, 30 years at 3% annual interest rate with monthly payments. What will be Ben's monthly payment? $1,250.00 $1,388.89 O...
The mass spectrum of 3-bromopropanoic acid is shown below. Four peaks are labeled with A, B,...
 The mass spectrum of 3-bromopropanoic acid is shown below. Four peaks are labeled with A, B, C, and D. Select the label for the M peak(s) (unfragmented parent). 135 27 45 55 18 26 10 20 30 40 50 60 70 80 90 100 110 120 130 140 150 160 170 MIZ
Step 2- Synthesis of 3-nitrobenzoate 11.5 110 10.5 100 200 850 75 7 65 60 550...
 Step 2- Synthesis of 3-nitrobenzoate 11.5 110 10.5 100 200 850 75 7 65 60 550 45 40 35 30 25 2015 tipp 30 220 210 200 180 180 170 160 150 140 130 120 110 100 f1 pm % 80 70 60 50 30 20 100 -10
Use the mass spectrum and either the NMR spectrum or the IR spectrum to deduce the...
 Use the mass spectrum and either the NMR spectrum or the IR
spectrum to deduce the structure of the following compound
(c) C8HO3H NMR, 300 MHz, 6.1 ppm (singlet, 2H), 6.9 ppm (doublet, 1H), and 7.3 ppm (singlet, 1H), 7.4 ppm (doublet, 1H), 9.8 ppm (singlet, 1H); significant IR absorbances at 1687, 1602, 1449, 1264, 1038, 929, and 815 cm1. 100 149 (150) 80 60 40 121 63 20 65 91 0 15 20 25 30 35 40 45 50...
Use the mass spectrum and either the NMR spectrum or the IR
spectrum to deduce the structure of the following compound
(c) C8HO3H NMR, 300 MHz, 6.1 ppm (singlet, 2H), 6.9 ppm (doublet, 1H), and 7.3 ppm (singlet, 1H), 7.4 ppm (doublet, 1H), 9.8 ppm (singlet, 1H); significant IR absorbances at 1687, 1602, 1449, 1264, 1038, 929, and 815 cm1. 100 149 (150) 80 60 40 121 63 20 65 91 0 15 20 25 30 35 40 45 50...
Help!!! 3. (34 points total) Below are EI-MS and IR data for an unknown compound: 134...
 Help!!!
3. (34 points total) Below are EI-MS and IR data for an unknown compound: 134 100 106 51 5 Mt 31 39 91 118 150 10 20 30 40 50 60 70 80 90 100 110 120 130 140 150 160 170 180 a 3 points) Draw the structure that best fits the data in the box provided.
Help!!!
3. (34 points total) Below are EI-MS and IR data for an unknown compound: 134 100 106 51 5 Mt 31 39 91 118 150 10 20 30 40 50 60 70 80 90 100 110 120 130 140 150 160 170 180 a 3 points) Draw the structure that best fits the data in the box provided.
170 160 150 e 130 120 110 100 90 80 70 0.6 0.8 Mole fraction of...
 170 160 150 e 130 120 110 100 90 80 70 0.6 0.8 Mole fraction of solvent A Answer the question using the temperature/composition diagram Check all the statements that are true with a mixture containing 0.8 mole fraction of solvent A. The mixture boils at about 162 °C O The boiling mixture produces a vapor with about 0.32 mole fraction of solvent A The boiling mixture produces a vapor with about 0.8 mole fraction of solvent A The composition...
Price (cents per gallon) 90 100 110 120 130 140 150 Quantity Demanded (thousand gallons per...
 Price (cents per gallon) 90 100 110 120 130 140 150 Quantity Demanded (thousand gallons per week 80 70 60 50 40 30 20 Quantity Supplied (thousand gallons per week 20 30 40 50 60 70 80 A market research team has come up with the demand and supply schedules for gasoline in Motorville in the table above. Use these data to analyze the situation in the market for gas in Motorville a) Draw a figure showing the demand curve...
 r 170 160+ 150 140+ 130 - 120 110 100+ 90 Supply 80- 70 60+ SO 40- Demand 30 20- 10- 2 4 6 8 10 12 14 16 18 20 22 24 26 28 30 Quantity of Loanable Funds Suppose the market for loanable funds opened up to international borrowers and savers. Further suppose that the real interest rate worldwide is 120 basis points (100 basis points = 1%). Would the gains from trade end up with the households...
 The mass spectrum of 3-bromopropanoic acid is shown below. Four peaks are labeled with A, B, C, and D. Select the label for the base peak(s). 45 55 18 26 on 10 20 30 40 50 60 70 80 90 100 MIZ 110 120 130 140 150 160 170 The mass spectrum of 3-bromopropanoic acid is shown below. Four peaks are labeled with A, B, C, and D. Select the label for the M peak(s) (unfragmented parent). 135 27 45...
 Suggest a composition for the halogen compound whose mass
spectrum is shown below and assign the labeled peaks.
127 100 173 160 158 162 25 48 TITTHTT 160 170 91 208 79 35 160 173 30 40 50 60 70 80 90 100 110 120 130 140 150 160 170 180 190 200 210 m/z
127 100 173 160 158 162 25 48 TITTHTT 160 170 91 208 79 35 160 173 30 40 50 60 70 80 90 100...
Suggest a composition for the halogen compound whose mass
spectrum is shown below and assign the labeled peaks.
127 100 173 160 158 162 25 48 TITTHTT 160 170 91 208 79 35 160 173 30 40 50 60 70 80 90 100 110 120 130 140 150 160 170 180 190 200 210 m/z
127 100 173 160 158 162 25 48 TITTHTT 160 170 91 208 79 35 160 173 30 40 50 60 70 80 90 100...
 20 30 40 50 60 70 80 99 100 110 120 130 140 150 160 170 180 190 259 260 270 280 290 300 310 320 330 340 350 360 370 380 390 400 410 420 430 490 500 51 52 53 545 QUESTION 47 Ben bought a house for $500,000. The bank will make a mortgage loan with 10% down, 30 years at 3% annual interest rate with monthly payments. What will be Ben's monthly payment? $1,250.00 $1,388.89 O...
 The mass spectrum of 3-bromopropanoic acid is shown below. Four peaks are labeled with A, B, C, and D. Select the label for the M peak(s) (unfragmented parent). 135 27 45 55 18 26 10 20 30 40 50 60 70 80 90 100 110 120 130 140 150 160 170 MIZ
 Step 2- Synthesis of 3-nitrobenzoate 11.5 110 10.5 100 200 850 75 7 65 60 550 45 40 35 30 25 2015 tipp 30 220 210 200 180 180 170 160 150 140 130 120 110 100 f1 pm % 80 70 60 50 30 20 100 -10
 Use the mass spectrum and either the NMR spectrum or the IR
spectrum to deduce the structure of the following compound
(c) C8HO3H NMR, 300 MHz, 6.1 ppm (singlet, 2H), 6.9 ppm (doublet, 1H), and 7.3 ppm (singlet, 1H), 7.4 ppm (doublet, 1H), 9.8 ppm (singlet, 1H); significant IR absorbances at 1687, 1602, 1449, 1264, 1038, 929, and 815 cm1. 100 149 (150) 80 60 40 121 63 20 65 91 0 15 20 25 30 35 40 45 50...
Use the mass spectrum and either the NMR spectrum or the IR
spectrum to deduce the structure of the following compound
(c) C8HO3H NMR, 300 MHz, 6.1 ppm (singlet, 2H), 6.9 ppm (doublet, 1H), and 7.3 ppm (singlet, 1H), 7.4 ppm (doublet, 1H), 9.8 ppm (singlet, 1H); significant IR absorbances at 1687, 1602, 1449, 1264, 1038, 929, and 815 cm1. 100 149 (150) 80 60 40 121 63 20 65 91 0 15 20 25 30 35 40 45 50...
 Help!!!
3. (34 points total) Below are EI-MS and IR data for an unknown compound: 134 100 106 51 5 Mt 31 39 91 118 150 10 20 30 40 50 60 70 80 90 100 110 120 130 140 150 160 170 180 a 3 points) Draw the structure that best fits the data in the box provided.
Help!!!
3. (34 points total) Below are EI-MS and IR data for an unknown compound: 134 100 106 51 5 Mt 31 39 91 118 150 10 20 30 40 50 60 70 80 90 100 110 120 130 140 150 160 170 180 a 3 points) Draw the structure that best fits the data in the box provided.
 170 160 150 e 130 120 110 100 90 80 70 0.6 0.8 Mole fraction of solvent A Answer the question using the temperature/composition diagram Check all the statements that are true with a mixture containing 0.8 mole fraction of solvent A. The mixture boils at about 162 °C O The boiling mixture produces a vapor with about 0.32 mole fraction of solvent A The boiling mixture produces a vapor with about 0.8 mole fraction of solvent A The composition...
 Price (cents per gallon) 90 100 110 120 130 140 150 Quantity Demanded (thousand gallons per week 80 70 60 50 40 30 20 Quantity Supplied (thousand gallons per week 20 30 40 50 60 70 80 A market research team has come up with the demand and supply schedules for gasoline in Motorville in the table above. Use these data to analyze the situation in the market for gas in Motorville a) Draw a figure showing the demand curve...
Most questions answered within 3 hours.
-
Part 1- Inventory: You own a toy company and
you are producing wooden rocking horses. Assume...
asked 6 minutes ago -
What is aromaticity?
Identify aromatic molecules, especially those containing O, N,
S and B
asked 9 minutes ago -
A rubber solid circular wheel of uniform density spins about it
axis at rate of 60...
asked 21 minutes ago -
DNA evidence from an early human skeleton in Britain, shows that
early inhabitants of were blue...
asked 12 minutes ago -
Financial data for Joel de Paris, Inc., for last year
follow:
Joel de Paris, Inc.
Balance...
asked 21 minutes ago -
To practice Problem-Solving Strategy 19.1 Work in Ideal-gas
Processes.
A cylinder with initial volume V contains...
asked 29 minutes ago -
Depreciation for Partial Periods Bean Delivery Company purchased
a new delivery truck for $35,400 on April...
asked 33 minutes ago -
Q 5.23:
Jonathan has been doing calculations to determine a missing
component. So far he has...
asked 31 minutes ago -
Use indifference curve and the daily income-leisure choice model
to explain graphically the behavior of employees...
asked 52 minutes ago -
Record the following transactions of Fashion Park in a
general journal. Fashion Park must charge 8...
asked 52 minutes ago -
Chapter 08 Python Assignment: Question 1-5
Please I need help in my python course.
Question 1...
asked 56 minutes ago -
1.
In a study of the effectiveness of
a new pain killer,
4646
out of
821821...
asked 1 hour ago