
Homework Answers


Add Answer to:
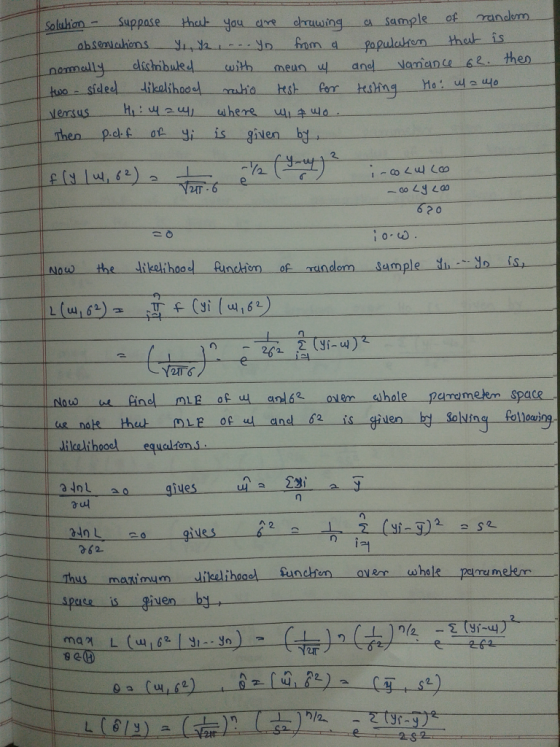
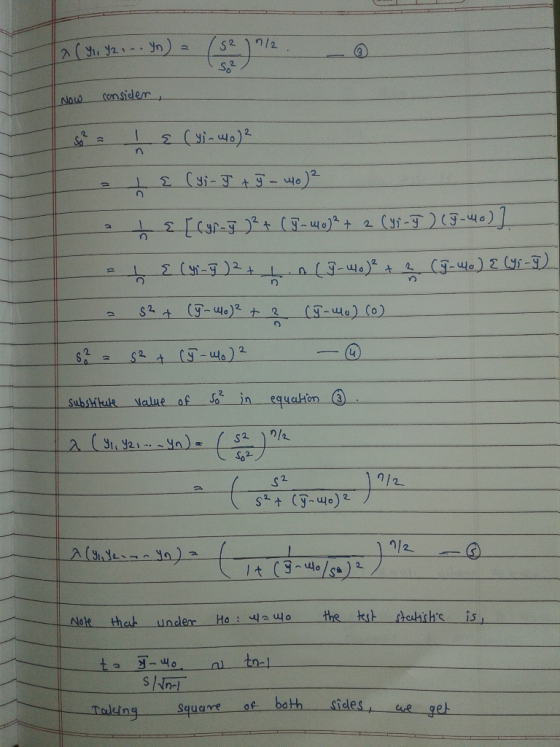
Q4). Suppose that you are drawing a sample of random observations yyy2y, from a population that is normally distributed with a mean- u and variance 2. Derive the two-sided likelihood ratio test f...
Question 3 with all work please. This is an upper-sided confidence interval for slope of a regression line, not a two-sided confidence interval. Bonus Questions how that for a set of design points su...
 Question 3 with all work please. This is an upper-sided
confidence interval for slope of a regression line, not a two-sided
confidence interval.
Bonus Questions how that for a set of design points such as x| , x2, design points are different then Σ(x-x) >0 , en f at least two of the (3 points) Q2). Show that for the linear regression model y-A, +B x + ε, the point estimate β, s an unbiased estimator for Po (5 points)...
Question 3 with all work please. This is an upper-sided
confidence interval for slope of a regression line, not a two-sided
confidence interval.
Bonus Questions how that for a set of design points such as x| , x2, design points are different then Σ(x-x) >0 , en f at least two of the (3 points) Q2). Show that for the linear regression model y-A, +B x + ε, the point estimate β, s an unbiased estimator for Po (5 points)...
Suppose that a random variable is normally distributed with mean μ and variance σ2 and we...
Suppose that a random variable is normally distributed with mean μ and variance σ2 and we draw a random sample of 5 observations from this distribution. What is the joint probability density function of the sample?
6. Let Xi 1,... ,Xn be a random sample from a normal distribution with mean u and variance ơ2 whi...
 6. Let Xi 1,... ,Xn be a random sample from a normal distribution with mean u and variance ơ2 which are both unknown. (a) Given observations xi, ,Xn, one would like to obtain a (1-a) x 100% one-sided confidence interval for u as a form of L E (-00, u) the expression of u for any a and n. (b) Based on part (a), use the duality between confidence interval and hypothesis testing problem, find a critical region of size...
Assume that a simple random sample has been selected from a normally distributed population and test...
 Assume that a simple random sample has been selected from a normally distributed population and test the given claim. State the final conclusion that addresses the original claim and select three correct choices. A manufacturer makes ball bearings that are supposed to have a mean weight of 30 g. A retailer suspects that the mean weight is actually less than 30 g. The mean weight for a random sample of 16 ball bearings is 29.2 g with a standard deviation...
Question 1: A random sample of 22 observations taken from a population that is normally distributed...
Question 1: A random sample of 22 observations taken from a population that is normally distributed produced a sample mean of 58.5 and a standard deviation of 7.5. Find the range for the p-value and the critical and observed values of t for the following test of hypothesis, using α = 0.01 . H 0 : μ = 55 versus H 1 : μ > 55 . Use the t distribution table to find a range for the p-value. Question 2: A...
A random sample of 25 observations was selected from a normally distributed population. The average in the sample was 84.6 with a variance of 400.
1. A random sample of 25 observations was selected from a normally distributed population. The average in the sample was 84.6 with a variance of 400.a. Construct a 90% confidence interval for μ.b. Construct a 99% confidence interval for μ.c. Discuss why the 90% and 99% confidence intervals are different.d. What would you expect to happen to the confidence interval in part (a) if the sample size was increased? Be sure to explain your answer.
1. (40) Suppose that X1, X2, Xn forms an independent and identically distributed sample from a normal distribution with mean μ and variance σ2, both unknown: 2nơ2 (a) Derive the sample variance, S2,...
 1. (40) Suppose that X1, X2, Xn forms an independent and identically distributed sample from a normal distribution with mean μ and variance σ2, both unknown: 2nơ2 (a) Derive the sample variance, S2, for this random sample. (b) Derive the maximum likelihood estimator (MLE) of μ and σ2 denoted μ and σ2, respectively. (c) Find the MLE of μ3 (d) Derive the method of moment estimator of μ and σ2, denoted μΜΟΜΕ and σ2MOME, respectively (e) Show that μ and...
Suppose a random sample of n = 25 observations is selected from a population that is...
Suppose a random sample of n = 25 observations is selected from a population that is normally distributed with mean equal to 109 and standard deviation equal to 15. (a) Find the probability that x exceeds 113. (b) Find the probability that the sample mean deviates from the population mean μ = 109 by no more than 5.
Suppose a random sample of n = 16 observations is selected from a population that is...
Suppose a random sample of n = 16 observations is selected from a population that is normally distributed with mean equal to 102 and standard deviation equal to 10. Find the probability that the sample mean deviates from the population mean μ = 102 by no more than 4. (Round your answer to four decimal places.)
Likelihood Ratio Tests - I only require (a) and (b) here. I'll post (c) and (d) for another question Let X1,..., Xn...
 Likelihood Ratio Tests - I only require (a) and (b)
here.
I'll post (c) and (d) for another question
Let X1,..., Xn be a random sample from the distribution with pdf { 0-1e--)e f(r μ, θ ) - 0. where E Rand 0 > 0 (a) If 0 is known but a is unknown, find a likelihood ratio test (LRT) of size a for testing Η : μ> Ho Ho Ho versus where oi a known constant (b) If 0...
Likelihood Ratio Tests - I only require (a) and (b)
here.
I'll post (c) and (d) for another question
Let X1,..., Xn be a random sample from the distribution with pdf { 0-1e--)e f(r μ, θ ) - 0. where E Rand 0 > 0 (a) If 0 is known but a is unknown, find a likelihood ratio test (LRT) of size a for testing Η : μ> Ho Ho Ho versus where oi a known constant (b) If 0...
 Question 3 with all work please. This is an upper-sided
confidence interval for slope of a regression line, not a two-sided
confidence interval.
Bonus Questions how that for a set of design points such as x| , x2, design points are different then Σ(x-x) >0 , en f at least two of the (3 points) Q2). Show that for the linear regression model y-A, +B x + ε, the point estimate β, s an unbiased estimator for Po (5 points)...
Question 3 with all work please. This is an upper-sided
confidence interval for slope of a regression line, not a two-sided
confidence interval.
Bonus Questions how that for a set of design points such as x| , x2, design points are different then Σ(x-x) >0 , en f at least two of the (3 points) Q2). Show that for the linear regression model y-A, +B x + ε, the point estimate β, s an unbiased estimator for Po (5 points)...
 6. Let Xi 1,... ,Xn be a random sample from a normal distribution with mean u and variance ơ2 which are both unknown. (a) Given observations xi, ,Xn, one would like to obtain a (1-a) x 100% one-sided confidence interval for u as a form of L E (-00, u) the expression of u for any a and n. (b) Based on part (a), use the duality between confidence interval and hypothesis testing problem, find a critical region of size...
 Assume that a simple random sample has been selected from a normally distributed population and test the given claim. State the final conclusion that addresses the original claim and select three correct choices. A manufacturer makes ball bearings that are supposed to have a mean weight of 30 g. A retailer suspects that the mean weight is actually less than 30 g. The mean weight for a random sample of 16 ball bearings is 29.2 g with a standard deviation...
 1. (40) Suppose that X1, X2, Xn forms an independent and identically distributed sample from a normal distribution with mean μ and variance σ2, both unknown: 2nơ2 (a) Derive the sample variance, S2, for this random sample. (b) Derive the maximum likelihood estimator (MLE) of μ and σ2 denoted μ and σ2, respectively. (c) Find the MLE of μ3 (d) Derive the method of moment estimator of μ and σ2, denoted μΜΟΜΕ and σ2MOME, respectively (e) Show that μ and...
 Likelihood Ratio Tests - I only require (a) and (b)
here.
I'll post (c) and (d) for another question
Let X1,..., Xn be a random sample from the distribution with pdf { 0-1e--)e f(r μ, θ ) - 0. where E Rand 0 > 0 (a) If 0 is known but a is unknown, find a likelihood ratio test (LRT) of size a for testing Η : μ> Ho Ho Ho versus where oi a known constant (b) If 0...
Likelihood Ratio Tests - I only require (a) and (b)
here.
I'll post (c) and (d) for another question
Let X1,..., Xn be a random sample from the distribution with pdf { 0-1e--)e f(r μ, θ ) - 0. where E Rand 0 > 0 (a) If 0 is known but a is unknown, find a likelihood ratio test (LRT) of size a for testing Η : μ> Ho Ho Ho versus where oi a known constant (b) If 0...
Most questions answered within 3 hours.
-
You have a 825.3 mL sample of 2.754 M HA (Ka =
4.49⋅10−4). Calculate the pH...
asked 1 hour ago -
The blues made its way into many kinds of music. Eric Clapton,
The Beatles, and Elvis...
asked 3 hours ago -
8. A wave in a string has a wave function given by: y (x, t) =...
asked 2 hours ago -
If you’re standing at the bottom of a hill and asked to evaluate
it while being...
asked 4 hours ago -
1. Which region has taken the lead in the world of
e-waste handling?
a) European Union...
asked 4 hours ago -
A 8.15- g bullet from a 9-mm pistol has a velocity of 366.0 m/s.
It strikes...
asked 6 hours ago -
The outstanding bonds of Alpha Extracts have a yield to maturity
of 7.4 percent and a...
asked 6 hours ago -
The Problem: The Case of the Harmonizing Vacations
Your CEO is exploring partnering with a European...
asked 7 hours ago -
A chemical equation is balanced by adding coefficients in front
of some formulas so that the...
asked 7 hours ago -
From the literature (reference your sources): What are the
lattice parameters of calcite and aragonite? Why...
asked 8 hours ago -
Your system is rejecting the question am asking which is
preceded by a case study. It...
asked 8 hours ago -
3. On January 2, 2000, Larry creates a trust with himself as
trustee. Larry as trustee...
asked 8 hours ago